. 2018 Jun 29;9(1):2544.
doi: 10.1038/s41467-018-04948-5.

Prioritizing network communities

Affiliations

Prioritizing network communities

Marinka Zitnik et al. Nat Commun. .

Abstract

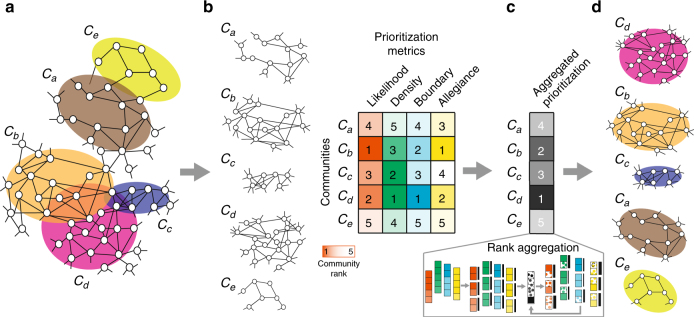
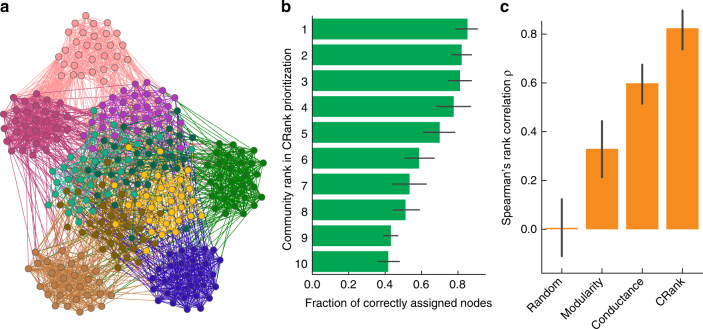
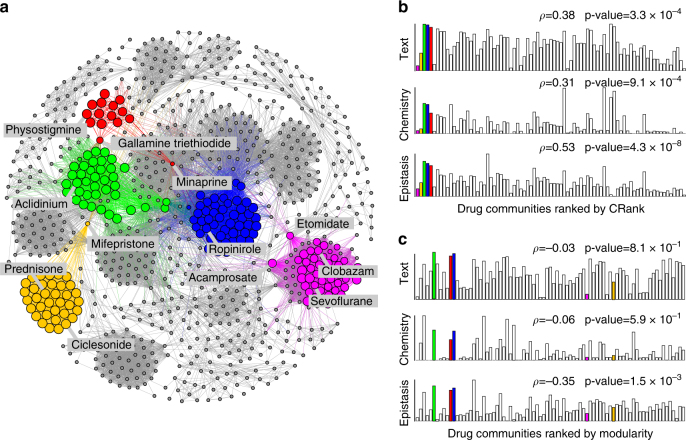
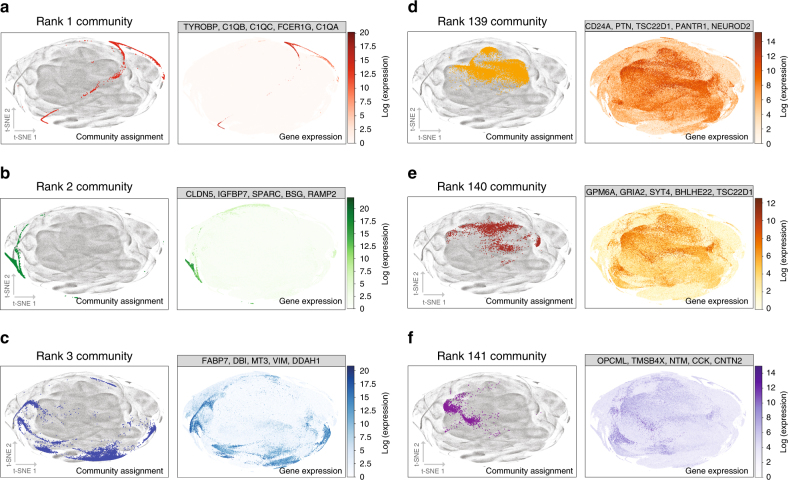
Uncovering modular structure in networks is fundamental for systems in biology, physics, and engineering. Community detection identifies candidate modules as hypotheses, which then need to be validated through experiments, such as mutagenesis in a biological laboratory. Only a few communities can typically be validated, and it is thus important to prioritize which communities to select for downstream experimentation. Here we develop CRANK, a mathematically principled approach for prioritizing network communities. CRANK efficiently evaluates robustness and magnitude of structural features of each community and then combines these features into the community prioritization. CRANK can be used with any community detection method. It needs only information provided by the network structure and does not require any additional metadata or labels. However, when available, CRANK can incorporate domain-specific information to further boost performance. Experiments on many large networks show that CRANK effectively prioritizes communities, yielding a nearly 50-fold improvement in community prioritization.


Conflict of interest statement

The authors declare no competing interests.

Figures

Fig. 1
Fig. 1
Prioritizing network communities. a Community detection methods take as input a network and output a grouping of nodes into communities. Highlighted are five communities, (Ca, …, Ce), that are detected in the illustrative network. b After communities are detected, the goal of community prioritization is to identify communities that are most promising targets for follow-up investigations. Promising targets are communities that are most associated with external network functions, such as cellular functions in protein–protein interaction networks, or cell types in cell–cell similarity networks. CRank is a community prioritization approach that ranks the detected communities using only information captured by the network structure and does not require any external data about the nodes or edges of the network. However, when external information about communities is available, CRank can make advantage of it to further improve performance (Supplementary Notes 9 and 10). CRank starts by evaluating four different structural features of each community: the overall likelihood of the edges in the community (likelihood), internal connectivity (density), external connectivity (boundary), and relationship with the rest of the network (allegiance). CRank can also integrate any number of additional user-defined metrics into the prioritization without any further changes to the method. c CRank then applies a rank aggregation method to combine the metrics and d produce the final ranking of communities
Fig. 2
Fig. 2
Synthetic networks with planted community structure. ac In networks with known modular structure we can evaluate community prioritization by quantifying the correspondence between detected communities and the planted communities. a Benchmark networks on N = 300 nodes are created using a stochastic block model with 10 planted communities. Each planted community has 30 nodes, which are colored by their planted community assignment. Planted communities use different values for within-community edge probability pin, five use pin = 0.6 and five use pin = 0.2. As a result, planted communities with smaller within-community probability pin are harder to detect. For each benchmark network we apply a community detection method to detect communities and then use CRank to prioritize them. CRank produces a ranked list of detected communities. The gold standard rank of each community is determined by how accurately it corresponds to its planted counterpart. b Each bar represents one detected community and the bars are ordered by CRank’s ranking with the highest-ranked community located at the top and the lowest ranked community located at the bottom. As a form of validation, the width of each bar corresponds to the fraction of nodes in a community that are correctly classified into a corresponding planted community, with error bars showing the 95% confidence intervals over 500 benchmark networks. A perfect prioritization ranks the bars by decreasing width. Notice that CRank perfectly prioritizes the communities even though it only uses information about the network structure, and has no access to information about the planted communities. c Prioritization performance is measured using Spearman’s rank correlation ρ between the generated ranking and the gold standard ranking of communities. A larger value of ρ indicates a better performance. Across all benchmark networks, CRank achieved average Spearman’s rank correlation of ρ = 0.82. Alternative approaches resulted in poorer average performance: ranking based on modularity and conductance achieved ρ = 0.33 and ρ = 0.60, respectively, whereas random prioritization obtained ρ = 0.00
Fig. 3
Fig. 3
Prioritizing network communities in the network of medical drugs. a The network of medical drugs connects two drugs if they share at least one target protein. Communities were detected by a community detection method, and then prioritized by CRank. Highlighted are five highest-ranked communities as determined by CRank. Nodes of the highlighted communities are sized by their score of the Likelihood prioritization metric (Supplementary Note 3). Investigation reveals that these communities contain drugs used to: treat asthma and allergies (e.g., prednisone, ciclesonide; yellow nodes), induce anesthesia or sedation (e.g., clobazam, etomidate, sevoflurane, acamprosate; magenta nodes), block neurotransmitters in central and peripheral nervous systems (e.g., physostigmine, minaprine, gallamine triethiodide; red nodes), block the activity of muscarinic receptors (e.g., acidinium; green nodes), and activate dopamine receptors (e.g., ropinirole; blue nodes). b, c We evaluate community prioritization against three external chemical databases (Supplementary Note 6) that were not used during community detection or prioritization. For each community we measure: (1) drug-drug interactions between the drugs (“Epistasis”), (2) chemical structure similarity of the drugs (“Chemistry”), and (3) associations between drugs derived from text data (“Text”). We expect that a true high-priority community will have more drug-drug interactions, higher similarity of chemical structure, and stronger textual associations between the drugs it contains. Taking this into consideration, the external chemical databases define three gold standard rankings of communities against which CRank is evaluated. Bars represent communities; bar height denotes similarity of drugs in a community with regard to the gold standard based on external chemical databases. In a perfect prioritization, bars would be ordered such that the heights would decrease from left to right. b CRank ranking of drug communities outperforms ranking by modularity c across all three chemical databases (as measured by Spearman’s rank correlation ρ with the gold standard ranking). CRank ranking achieves ρ = 0.38, 0.31, 0.53, while modularity obtains ρ = −0.03, −0.06, −0.35
Fig. 4
Fig. 4
Prioritizing network communities in the megascale cell–cell similarity network. The network of embryonic mouse brain has 1,306,127 nodes representing brain cells. Communities are detected using a community detection method developed for single-cell RNA-seq data and prioritized using CRank, generating a rank-ordered list of detected communities. ac Shown are three communities that are ranked high by CRank; a rank 1, b rank 2, and c rank 3 community. t-SNE projections show cells assigned to each community. t-SNE is a dimensionality reduction technique that is particularly well suited for visualization of high-dimensional data. Cells assigned to each community are distinguished by color, and all other cells are shown in gray. We investigate the quality of community ranking by examining gene markers for cells in each community. We use the single-cell RNA-seq data set to obtain a gene expression profile for each cell, indicating the activity of genes in the cell. For each community we then identify marker genes, i.e., genes with the strongest differential expression between cells assigned to the community and all other cells. In the t-SNE projection we then color the cells by how active the marker genes are. This investigation reveals that communities ranked high by CRank are represented by clusters of cells whose marker genes have a highly localized expression. For example, marker genes for rank 1 community in a (the highest community in CRank ranking) are TYROBP, C1QB, C1QC, FCER1G, and C1QA. Expression of these genes is concentrated in cells that belong to the rank 1 community. Similarly, marker genes for rank 2 and rank 3 communities are specifically active in cell populations that match well the boundary of each community. df t-SNE projections show cells assigned to 3 low-ranked communities; d rank 139, e rank 140, and f rank 141 community. t-SNE projections are produced using the same differential analysis as in ac. Although these communities correspond to clusters of cells in the t-SNE projections, their marker genes have diluted gene expression that is spread out over the entire network, indicating that CRank has correctly considered these communities to be low priority. For example, marker genes for rank 141 community in f are OPCML, TMSB4X, NYM, CCK, and CNTN2, which show a weak expression pattern that is diffused across the entire network
Fig. 5
Fig. 5
Combining community prioritization metrics without an external gold standard. a The rank aggregation algorithm starts with four ranked lists of communities, Rr, each one arising from the values of a different community prioritization metric r (where r is one of “l”— likelihood, “d”—density, “b”—boundary, “a”—allegiance). Communities are ordered by the decreasing value of the metric. We use C to indicate the rank of an illustrative community by the community prioritization metrics and at different stages of the algorithm. b Each ranked list is partitioned into equally sized groups, called bags. Each bag i in ranked list Rr has attached importance weight Kri whose initial values are all equal (represented by black bars all of same width). CRank uses the importance weights Kri to initialize aggregate prioritization R as a weighted average of community ranks Rl, Rd, Rb, Ra. c The top-ranked communities (denoted as dotted cells) in the aggregated prioritization R serve as a temporary gold standard, which is then used to iteratively update the importance weights Kri. d In each iteration, CRank updates importance weights using the Bayes factor calculation (Supplementary Note 4). Given bag i and ranked list Rr, CRank updates importance weight Kri, based on how many communities from the temporary gold standard appear in bag i. Updated importance weights then revise the aggregated prioritization in which the new rank R(C) of community C is expressed as: R(C) = rlogKrir(C)Rr(C), where Krir(C) indicates the importance weight of bag ir(C) of community C for metric r, and Rr(C) is the rank of C according to r. By using an iterative approach, CRank allows for the importance of a metric not to be predetermined and to vary across communities

References

    1. Benson AR, Gleich DF, Leskovec J. Higher-order organization of complex networks. Science. 2016;353:163–166. doi: 10.1126/science.aad9029. - DOI - PMC - PubMed
    1. Menche J, et al. Uncovering disease-disease relationships through the incomplete interactome. Science. 2015;347:1257601. doi: 10.1126/science.1257601. - DOI - PMC - PubMed
    1. Costanzo M, et al. A global genetic interaction network maps a wiring diagram of cellular function. Science. 2016;353:1381. doi: 10.1126/science.aaf1420. - DOI - PMC - PubMed
    1. Fortunato S. Community detection in graphs. Phys. Rep. 2010;486:75–174. doi: 10.1016/j.physrep.2009.11.002. - DOI
    1. Newman ME. Modularity and community structure in networks. Proc. Natl Acad. Sci. USA. 2006;103:8577–8582. doi: 10.1073/pnas.0601602103. - DOI - PMC - PubMed

Publication types

MeSH terms

LinkOut - more resources