. 2018 Jun 29;9(1):2546.
doi: 10.1038/s41467-018-04647-1.

Harnessing synthetic lethality to predict the response to cancer treatment

Affiliations

Harnessing synthetic lethality to predict the response to cancer treatment

Joo Sang Lee et al. Nat Commun. .

Abstract

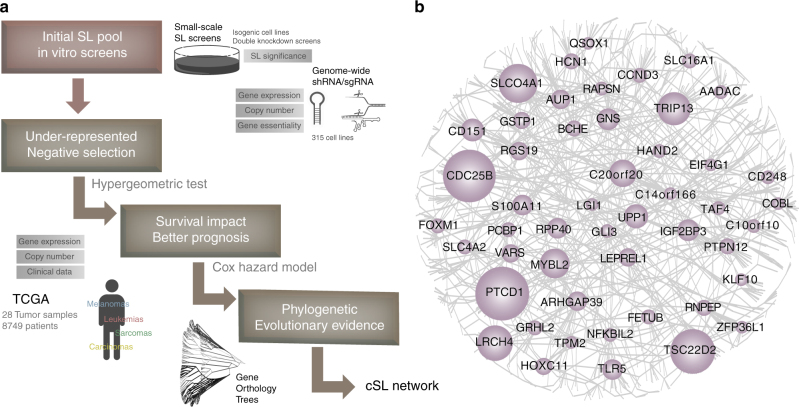
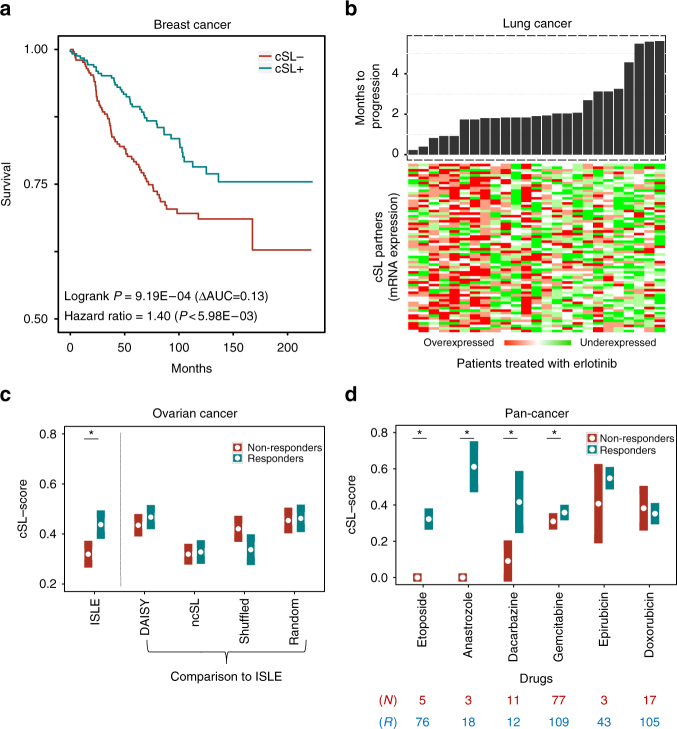
While synthetic lethality (SL) holds promise in developing effective cancer therapies, SL candidates found via experimental screens often have limited translational value. Here we present a data-driven approach, ISLE (identification of clinically relevant synthetic lethality), that mines TCGA cohort to identify the most likely clinically relevant SL interactions (cSLi) from a given candidate set of lab-screened SLi. We first validate ISLE via a benchmark of large-scale drug response screens and by predicting drug efficacy in mouse xenograft models. We then experimentally test a select set of predicted cSLi via new screening experiments, validating their predicted context-specific sensitivity in hypoxic vs normoxic conditions and demonstrating cSLi's utility in predicting synergistic drug combinations. We show that cSLi can successfully predict patients' drug treatment response and provide patient stratification signatures. ISLE thus complements existing actionable mutation-based methods for precision cancer therapy, offering an opportunity to expand its scope to the whole genome.


Conflict of interest statement

The authors declare no competing interests.

Figures

Fig. 1
Fig. 1
ISLE framework and the clinical-SL-network. a The three step inference procedure of ISLE and the datasets used in each step (Methods). b The core clinical-SL-network (with FDR < 0.1) includes 2326 interactions between 2153 genes, where the gene names having more than 10 cSL partners are marked; the size of nodes is proportional to the number of interactions they have). The complete network with FDR < 0.2 (the correction level used in all analyses presented in the paper) is provided in Supplementary Fig. 1 and in an interactive form at GitHub: https://github.com/jooslee/ISLE/
Fig. 2
Fig. 2
ISLE-based prediction of in vitro and in vivo drug response. a Prediction of in vitro drug response using drug-cSL-network in the CCLE collections. The ROC curve compares the prediction performance of ISLE, ncSL, and DAISY (Methods). b Predicting in vivo drug response using drug-cSL-network. Mouse xenograft samples marked as responders (blue) show higher cSL-scores compared to the samples marked as non-responders (red). The X-axis shows seven drugs where sufficient drug response data are available and the Y-axis depicts the cSL-score (divided by the total number of SL partners to guide visualization, mean and s.e.m). (* marks the five drugs that are significantly predicted after multiple hypothesis correction (FDR-corrected Wilcoxon rank sum P < 0.2), and drugs are listed in order of significance). c Benchmarking ISLE-based drug response prediction versus the DREAM7 challenge. The figure shows prediction accuracy (evaluated using a variant of concordance index (Methods); Y-axis) of ISLE (red) and top five approaches (gray) both for the drug response to single agent (left columns) and drug combinations (right columns). d Predicting drug synergy. The AUC of ROC curves displaying the SL-based prediction accuracy of synergistic drug combination screens of a recent DREAM challenge, and a large collection of mouse xenograft models. Results are shown for ISLE cSL interactions (red) and compared with the DAISY SL-network (yellow), ncSL network (green), and randomly permuted networks (gray)
Fig. 3
Fig. 3
New experiments to test ISLE-based predictions on growth inhibition and drug combinations. a, b cSL-based prediction of growth inhibition in a knockdown screen in oral cancer. a Growth rate prediction: The number of downregulated cSL partners of a gene (X-axis; cSL-score) is associated with the percentage of growth inhibition observed after its knockdown (Y-axis; quantified as percent-growth inhibition compared to control, mean and s.e.m). Each bin of cSL-score shows significant differences (FDR-corrected t-test P < 0.2*, see Supplementary Note 1). b cSL-based context-specific prediction of growth inhibition in hypoxic vs normoxic conditions. The fold change of cSL-score (X-axis in logscale) in normoxia vs. hypoxia shows a positive correlation with the corresponding growth inhibition fold change (Y-axis in logscale), correctly predicting the differentially observed growth inhibition in more than 71% of the 38 cases observed experimentally (marked as red dots in the 1st and 3rd quadrants). c, d The figures depict the representative dose response curves (see Supplementary Fig. 7B, C for other cell lines) of the predicted synergistic drug combinations of c ABT263 (BCL2L1 inhibitor) and the OSI906 (IGF1R inhibitor) and d GDC0941 (PIK3CA inhibitor) and the MK2206 (AKT1 inhibitor). The percentage of cell line survival (Y-axis) was measured at varying doses of OSI906 (respectively MK2206), with and without ABT263 (respectively GDC0941) treatment at 5uM (X-axis). The dashed lines denote the percentage of cell line survival at varying levels of OSI906 (MK2206) without ABT263 (GDC0941) treatments, and the solid lines denote the percentage of cell line survival at varying levels of OSI906 (MK2206) in the presence of 5 μM of ABT263 (GDC0941). The combined drug treatments are significantly more effective than the single treatments based on the analysis of variance (P < 3.17E-11 (c) and P < 2.71E-8 (d)). The Fa–CI curve for all drug combinations are in Supplementary Fig. 7D, and the full experimental measurements are presented in Supplementary Data 11, 12
Fig. 4
Fig. 4
Drug-cSL-network predicts treatment outcomes in cancer patients. a The KM plot of predicted responders (blue) vs non-responders (red) to taxane-anthracycline chemotherapy. We divided the patients into responders vs non-responders based on the median value of their cSL-scores. b The gene expression of the cSL partners in patients treated with erlotinib,, ordered according to their months-to-progression (on-top). As predicted, patients with many downregulated cSL partners progressed slower. c The responders (blue) to taxane-cisplatin therapy for ovarian cancer show significantly higher ISLE cSL-scores than the non-responders (red) (Wilcoxon rank sum P < 9.1E-3). The X-axis shows the different groups of partners studied, and Y-axis provides their cSL-scores in responders vs non-responders. d TCGA patients with a large number of downregulated drug-cSL partners in their tumors show better response based on RECIST criteria. X-axis shows six drugs that have considerable (>12 samples) drug response information in TCGA, and Y-axis represents the cSL-score (divided by total number of SL partners to guide visualization, mean and s.e.m) of their drug targets, where cancer types are controlled for (* marks the four drugs that are significantly predicted after multiple hypothesis corrections (FDR-corrected Wilcoxon rank sum P < 0.2, and epirubicin FDR < 0.23), drugs are listed in order of significance). Blue (red) bars denote the cSL-scores of the responders (non-responders), and the numbers marked in blue (red) below the figure indicate the number of responders (non-responders) for each drug. All the analyses were performed using the drug-cSL-network (presented in Supplementary Fig. 8) based on the drug-target mapping available listed in Supplementary Data 13

References

    1. Hartwell LH, Szankasi P, Roberts CJ, Murray AW, Friend SH. Integrating genetic approaches into the discovery of anticancer drugs. Science. 1997;278:1064–1068. doi: 10.1126/science.278.5340.1064. - DOI - PubMed
    1. Brough R, Frankum JR, Costa-Cabral S, Lord CJ, Ashworth A. Searching for synthetic lethality in cancer. Curr. Opin. Genet. & Dev. 2011;21:34–41. doi: 10.1016/j.gde.2010.10.009. - DOI - PubMed
    1. Kaelin W. The concept of synthetic lethality in the context of anticancer therapy. Nat. Rev. Cancer. 2005;5:689–698. doi: 10.1038/nrc1691. - DOI - PubMed
    1. Luo J, Solimini NL, Elledge SJ. Principles of cancer therapy: oncogene and non-oncogene addiction. Cell. 2009;136:823–837. doi: 10.1016/j.cell.2009.02.024. - DOI - PMC - PubMed
    1. Ashworth A, Lord CJ, Reis-Filho JS. Genetic interactions in cancer progression and treatment. Cell. 2011;145:30–38. doi: 10.1016/j.cell.2011.03.020. - DOI - PubMed

Publication types