. 2018 Jun 29;8(1):9860.
doi: 10.1038/s41598-018-27910-3.

The pial vasculature of the mouse develops according to a sensory-independent program

Affiliations

The pial vasculature of the mouse develops according to a sensory-independent program

Matthew D Adams et al. Sci Rep. .

Abstract

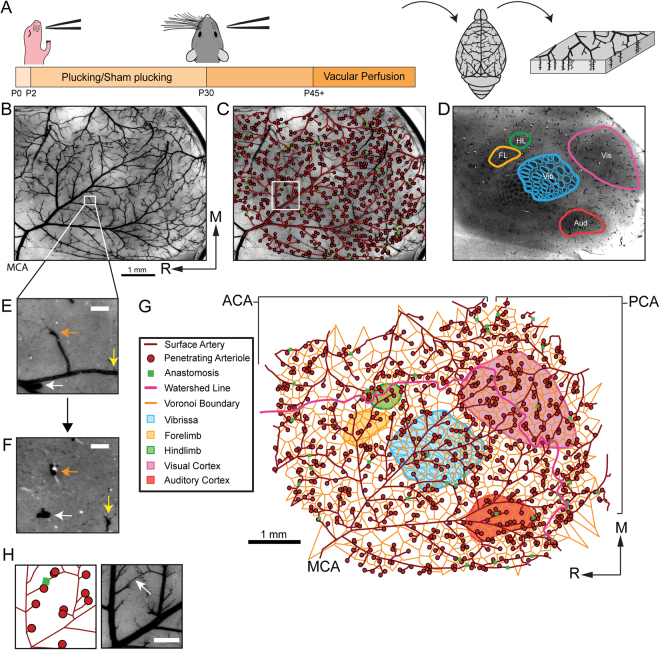
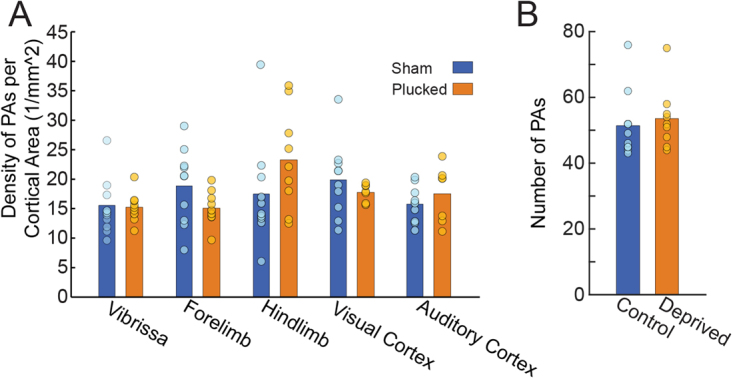
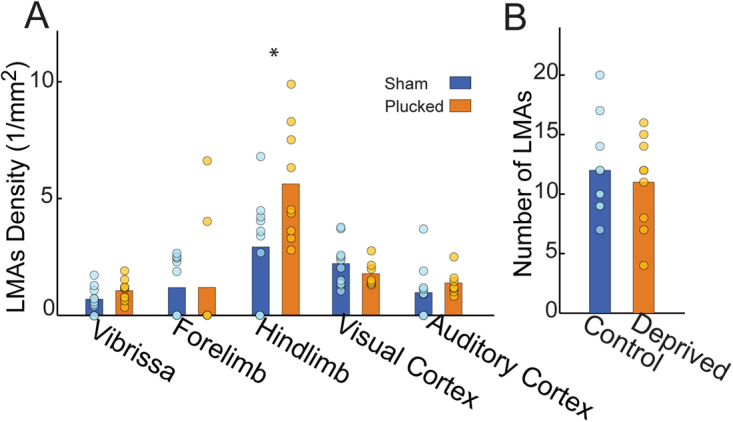
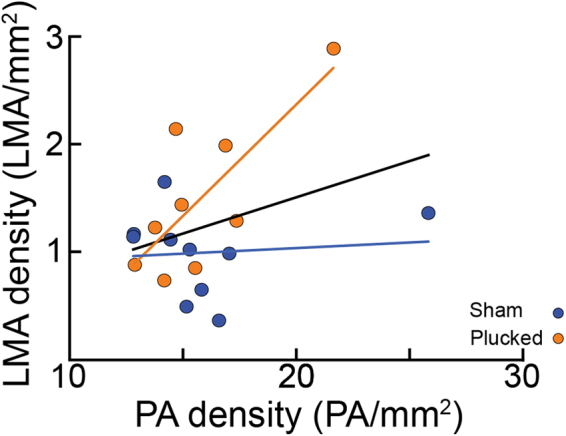
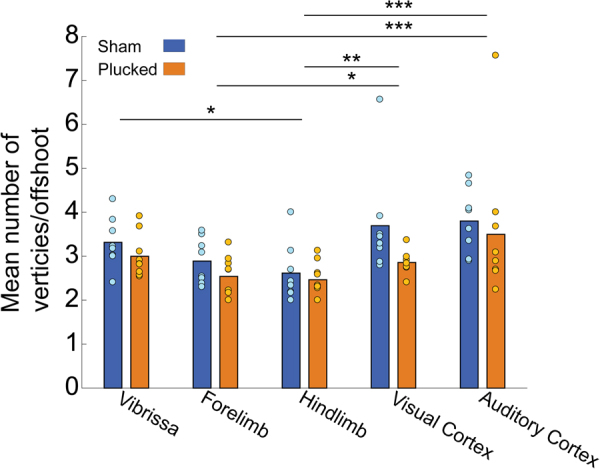
The cerebral vasculature is organized to supply the brain's metabolic needs. Sensory deprivation during the early postnatal period causes altered neural activity and lower metabolic demand. Neural activity is instructional for some aspects of vascular development, and deprivation causes changes in capillary density in the deprived brain region. However, it is not known if the pial arteriole network, which contains many leptomeningeal anastomoses (LMAs) that endow the network with redundancy against occlusions, is also affected by sensory deprivation. We quantified the effects of early-life sensory deprivation via whisker plucking on the densities of LMAs and penetrating arterioles (PAs) in anatomically-identified primary sensory regions (vibrissae cortex, forelimb/hindlimb cortex, visual cortex and auditory cortex) in mice. We found that the densities of penetrating arterioles were the same across cortical regions, though the hindlimb representation had a higher density of LMAs than other sensory regions. We found that the densities of PAs and LMAs, as well as quantitative measures of network topology, were not affected by sensory deprivation. Our results show that the postnatal development of the pial arterial network is robust to sensory deprivation.


Conflict of interest statement

The authors declare no competing interests.

Figures

Figure 1
Figure 1
Reconstructing the pial arterial network with respect to the underlying neuroanatomy. (A) Schematic of experimental timeline. Whisker plucking/sham plucking was performed between P2 and P30, mice were sacrificed after P45. The vasculature was filled, the brain extracted, and the cortex flattened. (B) Photograph of a cortical slab. The Middle Cerebral Artery (MCA) is labeled in the bottom left corner. Scale bar: 1 mm. (C) The arterial vascular tracing overlaid on a picture of the slab vasculature. The arterial backbone is depicted in dark red. Penetrating arterioles (PAs) are depicted as red circles, and leptomeningeal anastomoses (LMAs) are shown as green squares. (D) Tangential section stained for CO, with S1 (vibrissae, forelimb, and hindlimb regions), visual, and auditory cortices denoted by colored lines. (E) Zoomed image of filled vasculature in (B). The white, orange, and yellow arrows point to penetrating arterioles (PAs). Scale bar: 100 µm. (F) A tangential slice taken just below the image in (E) demonstrating that a PA location can be verified by following it into the parenchyma. Colored arrows denote the same PAs noted in the previous image. (G) The completed pial arterial vascular reconstruction, including the anatomically-identified cortical regions, Voronoi cells centered around PAs (orange), and watershed line (pink) between the Anterior Cerebral Artery (ACA) and MCA, and Posterior Cerebral Artery (PCA) and MCA. Note that PAs and LMAs are both vessels, though they are denoted by point markers. Scale bar: 1 mm. (H) Zoomed image of anastomoses (box in C). Scale bar: 0.25 mm.
Figure 2
Figure 2
(A) Density of PAs plotted for five identified cortical areas (Sham: n = 10; Plucked: n = 9). Bars show mean across animals within a treatment (sham or deprived); circles show data points from individual animals. Color denotes group. (B) Comparison of the total number of PAs in plucked and control mice within the anatomically-identified barrel, forelimb and hindlimb areas. The PA count spans a factor of two in both conditions.
Figure 3
Figure 3
Lemtomeningeal anastomoses density was higher in the hindlimb representation of somatosensory cortex, but was not altered by sensory deprivation. (A) Density of LMAs for five cortical sensory areas. (B) Comparison of the total number of LMAs in sham-treated and plucked mice within the anatomically-identified barrel, forelimb, hindlimb areas. The LMA count spans a factor of three. Bars show means across animals within a treatment group, circles are data points from individual animals.
Figure 4
Figure 4
Relationship between number of LMAs and PAs. The number of PAs vs the number of LMAs within the barrel, forelimb, and hindlimb regions. While the number of PAs and LMAs trend together, the two vascular features were not significantly related (Linear regression fit by least squares, pooled data: p > 0.42, Bonferroni corrected, t(17) = 1.54; plucked: p = 0.051, Bonferroni corrected, t(7) = 3.10; sham: p > 0.79, Bonferroni corrected, t(8) = 0.28), suggesting that they develop independently. Each circle represents an individual mouse. Lines indicate linear fit.
Figure 5
Figure 5
Quantification of network topology with a vertex-per-offshoot metric. Offshoot branches are vascular segments that emerge from the main backbone of the pial network (i.e. the portion that remains on the pial surface) and lead to penetrating arteries. For each such branch, we count the number of vertices (either a bifurcation or a penetrating artery). Plot of the mean vertex/offshoot ratio across cortical area. Bars show means, circles are individual animals. There was no effect of deprivation on the vertex/offshoot ratio, but the hindlimb area had a lower ratio than the vibrissa, visual and auditory cortex. The forelimb area had a significantly lower ratio than visual and auditory cortex. *p < 0.05; **p < 0.01; ***p < 0.001.

Similar articles

Cited by

References

    1. Howarth C, Gleeson P, Attwell D. Updated energy budgets for neural computation in the neocortex and cerebellum. J Cereb Blood Flow Metab. 2012;32:1222–1232. doi: 10.1038/jcbfm.2012.35. - DOI - PMC - PubMed
    1. Engl E, Jolivet R, Hall CN, Attwell D. Non-signalling energy use in the developing rat brain. J Cereb Blood Flow Metab. 2017;37:951–966. doi: 10.1177/0271678X16648710. - DOI - PMC - PubMed
    1. Harris J, Attwell D. The energetics of CNS white matter. Journal of Neuroscience. 2012;32:356–371. doi: 10.1523/JNEUROSCI.3430-11.2012. - DOI - PMC - PubMed
    1. Harris JJ, Jolivet R, Attwell D. Synaptic Energy Use and Supply. Neuron. 2012;75:762–777. doi: 10.1016/j.neuron.2012.08.019. - DOI - PubMed
    1. Attwell D, et al. Glial and neuronal control of brain blood flow. Nature. 2010;468:232–243. doi: 10.1038/nature09613. - DOI - PMC - PubMed

Publication types

LinkOut - more resources