. 2018 Jun 29;8(1):9883.
doi: 10.1038/s41598-018-28118-1.

Circulating miR-30a-5p as a prognostic biomarker of left ventricular dysfunction after acute myocardial infarction

Affiliations

Circulating miR-30a-5p as a prognostic biomarker of left ventricular dysfunction after acute myocardial infarction

Agata Maciejak et al. Sci Rep. .

Abstract

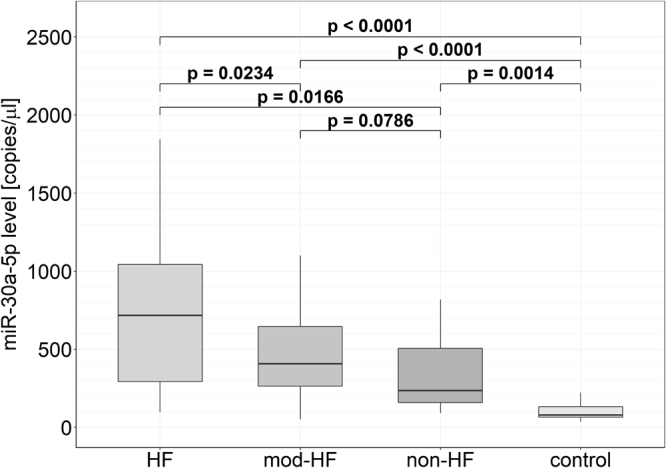
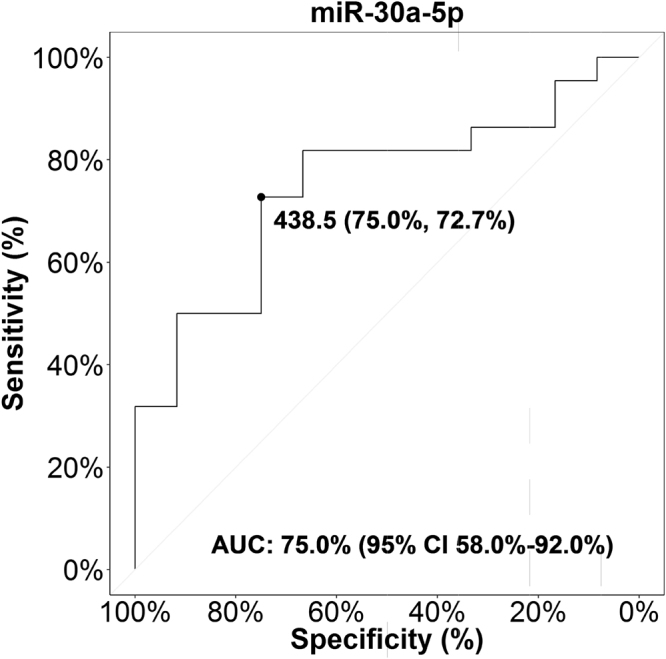
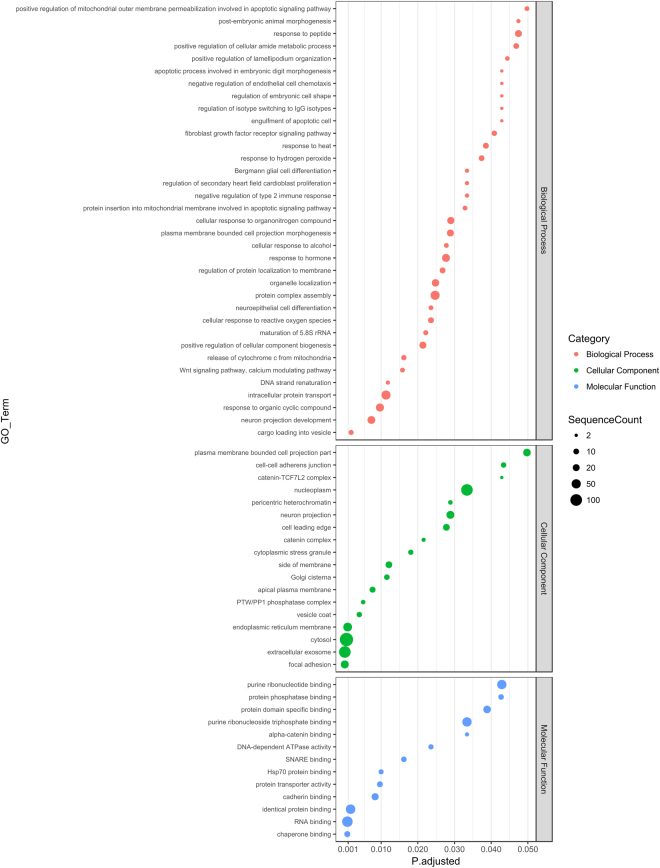
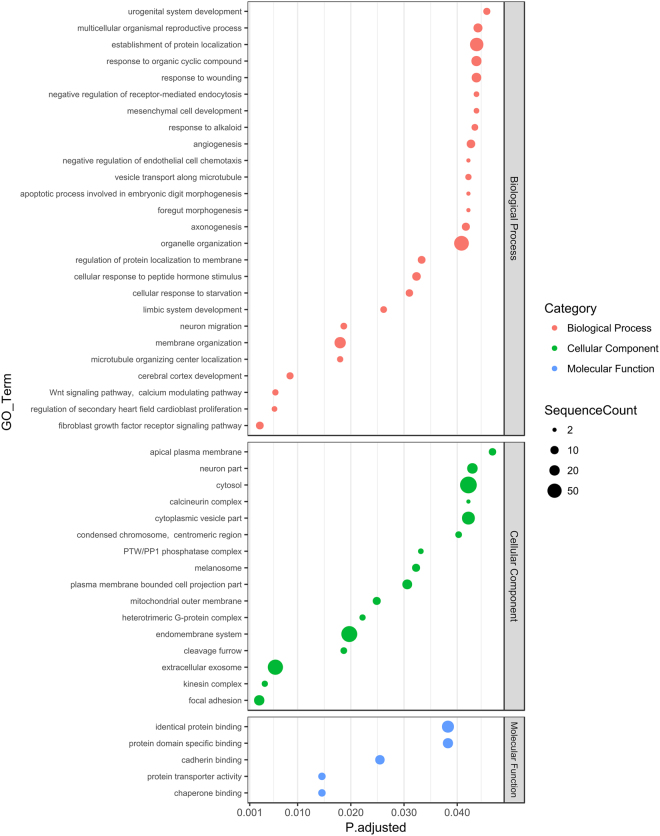
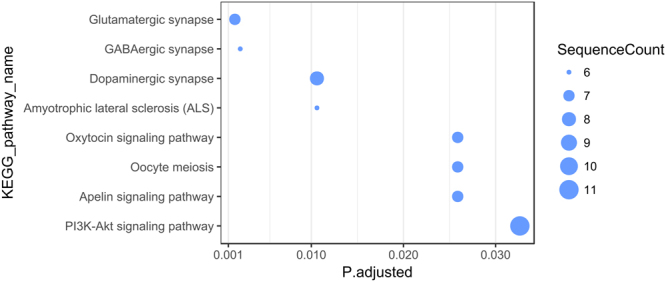
Left ventricular (LV) dysfunction after acute myocardial infarction (AMI) is associated with an increased risk of heart failure (HF) development. Diverse microRNAs (miRNAs) have been shown to appear in the bloodstream following various cardiovascular events. The aim of this study was to identify prognostic miRNAs associated with LV dysfunction following AMI. Patients were divided into subgroups comprising patients who developed or not LV dysfunction within six months of the infarction. miRNA profiles were determined in plasma and serum samples of the patients on the first day of AMI. Levels of 14 plasma miRNAs and 16 serum miRNAs were significantly different in samples from AMI patients who later developed LV dysfunction compared to those who did not. Two miRNAs were up-regulated in both types of material. Validation in an independent group of patients, using droplet digital PCR (ddPCR) confirmed that miR-30a-5p was significantly elevated on admission in those patients who developed LV dysfunction and HF symptoms six months after AMI. A bioinformatics analysis indicated that miR-30a-5p may regulate genes involved in cardiovascular pathogenesis. This study demonstrates, for the first time, a prognostic value of circulating miR-30a-5p and its association with LV dysfunction and symptoms of HF after AMI.


Conflict of interest statement

The authors declare no competing interests.

Figures

Figure 1
Figure 1
Levels of miR-30a-5p in serum samples from HF, mod-HF, non-HF and CAD control groups. Box plots show the levels of miR-30a-5p measured by ddPCR and expressed in copies per microliter of serum. The bottom and top of each box represents the 1st and 3rd quartiles of the data, respectively. The median (HF: 787.6 [348.8, 1216.0], mod-HF: 407,4 [264.0, 645.3], non-HF: 235.8 [159.9, 505.6], CAD: 79.2 [65.5, 133.2]) is shown as a solid line across the box.
Figure 2
Figure 2
ROC curve for miR-30a-5p. ROC curve analysis of miR-30a-5p level in serum (copies/µl) of n = 22 HF and n = 12 non-HF patients. AUC, area under the curve; CI, confidence interval; ROC, receiver operating characteristic.
Figure 3
Figure 3
Enriched GO terms for predicted miR-30a-5p targets expressed in the heart. Putative gene targets of miR-30a-5p expressed in the heart were predicted as detailed in Materials and Methods and subjected to a GO enrichment analysis. All genes expressed in the heart served as the background population set. The figure shows enriched GO terms (lowest hierarchy level) from the “Biological Process”, “Molecular Function” and “Cellular Component” categories. The sizes of the dots reflect the number of targets annotated by a given GO term. Only terms with adjusted p-value < 0.05 are shown.
Figure 4
Figure 4
Enriched GO terms for predicted miR-30a-5p targets expressed in whole blood. Putative gene targets of miR-30a-5p expressed in blood were predicted as detailed in Materials and Methods and subjected to a GO enrichment analysis. All genes expressed in the whole blood served as the background population set. The figure shows enriched GO terms (lowest hierarchy level) from the “Biological Process”, “Molecular Function” and “Cellular Component” categories. The sizes of the dots reflect the number of targets annotated by a given GO term. Only terms with adjusted p-value < 0.05 are shown.
Figure 5
Figure 5
Enriched KEGG pathways for predicted miR-30a-5p targets expressed in whole blood. The KEGG pathway enrichment analysis was performed as detailed in Materials and Methods. Putative gene targets of miR-30a-5p expressed in whole blood were used as the target set. All genes expressed in whole blood served as the background population set. The sizes of the dots reflect the number of targets mapped on a given KEGG pathway. The p-value/Q-value thresholds were set at 0.05.

References

    1. Gajarsa JJ, Kloner RA. Left ventricular remodeling in the post-infarction heart: a review of cellular, molecular mechanisms, and therapeutic modalities. Heart Fail Rev. 2011;16:13–21. doi: 10.1007/s10741-010-9181-7. - DOI - PubMed
    1. Frangogiannis NG. Pathophysiology of myocardial infarction. Compr Physiol. 2015;5:1841–1875. doi: 10.1002/cphy.c150006. - DOI - PubMed
    1. Azevedo PS, Polegato BF, Minicucci MF, Paiva SA, Zornoff LA. Cardiac remodeling: concepts, clinical impact, pathophysiological mechanisms and pharmacologic treatment. Arq Bras Cardiol. 2016;106:62–69. - PMC - PubMed
    1. Zornoff LA, Paiva SA, Duarte DR, Spadaro J. Ventricular remodeling after myocardial infarction: concepts and clinical implications. Arq Bras Cardiol. 2009;92:150–164. doi: 10.1590/S0066-782X2009000200013. - DOI - PubMed
    1. Savoye C, et al. REmodelage VEntriculaire study group. Left ventricular remodeling after anterior wall acute myocardial infarction in modern clinical practice (from the REmodelage VEntriculaire [REVE] study group) Am J Cardiol. 2006;98:1144–1149. doi: 10.1016/j.amjcard.2006.06.011. - DOI - PubMed

Publication types