Review
. 2018 Nov:196:40-48.
doi: 10.1016/j.clim.2018.06.009. Epub 2018 Jun 28.

Single-cell epigenetics - Chromatin modification atlas unveiled by mass cytometry

Affiliations
Review

Single-cell epigenetics - Chromatin modification atlas unveiled by mass cytometry

Peggie Cheung et al. Clin Immunol. 2018 Nov.

Abstract

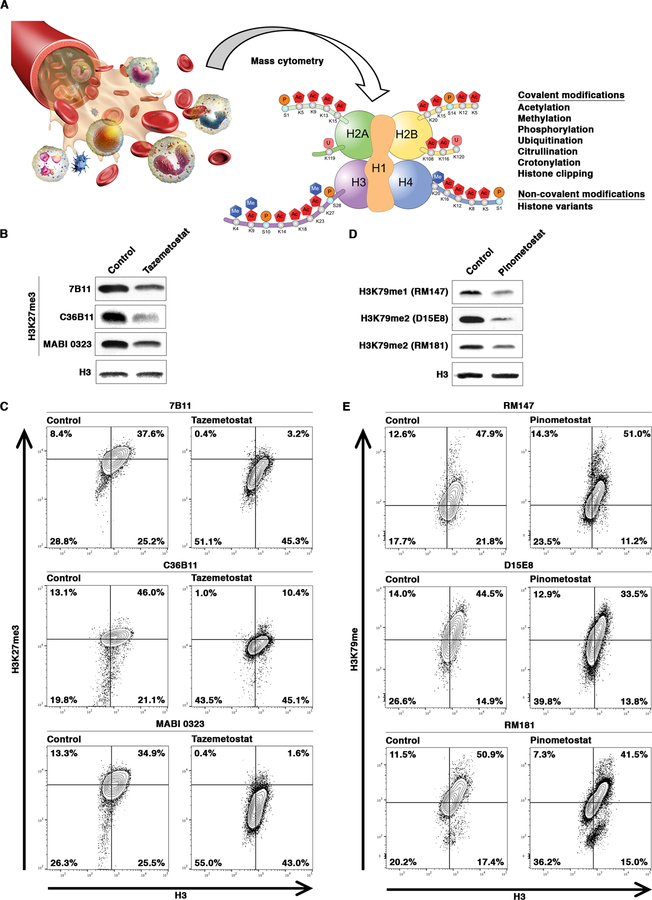
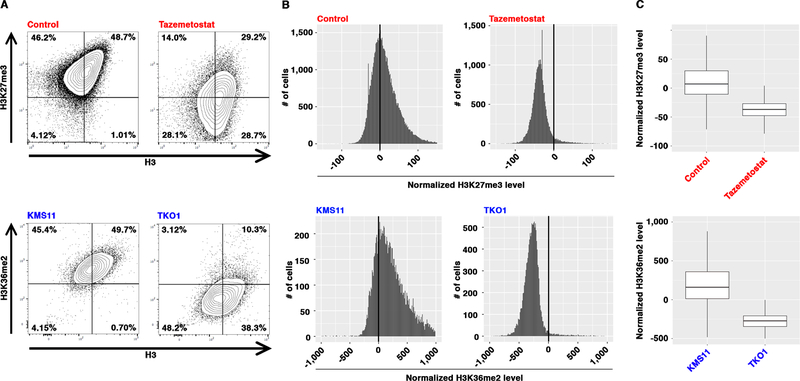
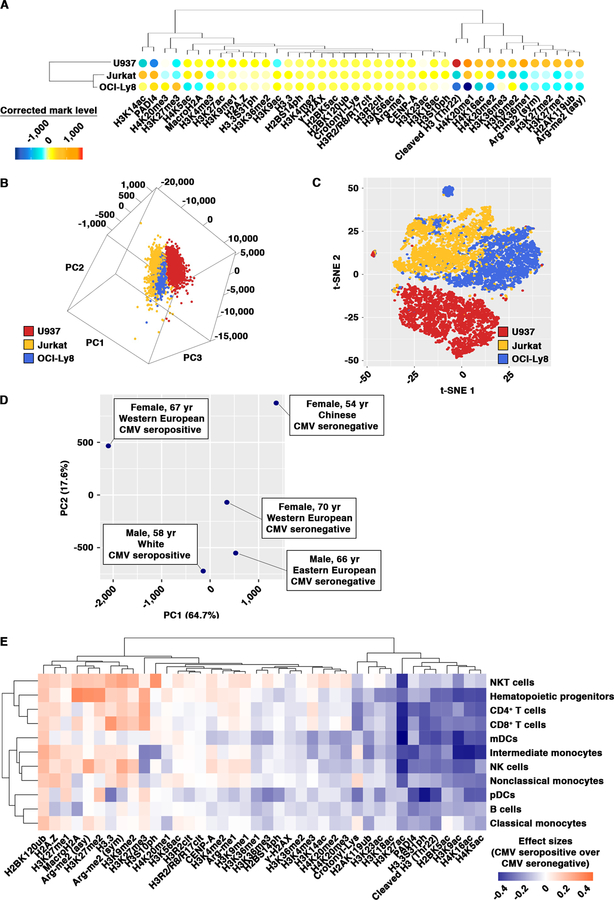
Modifications of histone proteins are fundamental to the regulation of epigenetic phenotypes. Dysregulations of histone modifications have been linked to the pathogenesis of diverse human diseases. However, identifying differential histone modifications in patients with immune-mediated diseases has been challenging, in part due to the lack of a powerful analytic platform to study histone modifications in the complex human immune system. We recently developed a highly multiplexed platform, Epigenetic landscape profiling using cytometry by Time-Of-Flight (EpiTOF), to analyze the global levels of a broad array of histone modifications in single cells using mass cytometry. In this review, we summarize the development of EpiTOF and discuss its potential applications in biomedical research. We anticipate that this platform will provide new insights into the roles of epigenetic regulation in hematopoiesis, immune cell functions, and immune system aging, and reveal aberrant epigenetic patterns associated with immune-mediated diseases.

Keywords: Chromatin; EpiTOF; Epigenetics; Histone post-translational modifications; Immune system; Mass cytometry.


Conflict of interest statement

Conflict of Interest

The authors declare no competing interests.

Figures

Figure 1
Figure 1. Selection and Validation of Affinity Reagents for EpiTOF.
(A) Overview of EpiTOF platform. (B) Validation of H3K27me3 antibodies under denaturing condition. Western blotting analysis of whole-cell extract from Jurkat cells cultured in the absence or presence of EZH2 inhibitor Tazemetostat using the indicated monoclonal antibodies. Control, DMSO-treated cells. (C) Validation of H3K27me3 antibodies under native condition. Mass cytometry analysis of the cells as in (B) using the indicated monoclonal antibodies. Contour plots: x-axis, antibodies against total histone H3; y-axis, antibodies against H3K27me3. Percentage of cells in each quadrant is shown. (D) Validation of H3K79me antibodies under denaturing condition. Western blotting analysis of whole-cell extract from Jurkat cells cultured in the absence or presence of DOT1L inhibitor Pinometostat using the indicated monoclonal antibodies. Control, DMSO-treated cells. (E) Validation of H3K79me antibodies under native condition. Mass cytometry analysis of the cells as in (D) using the indicated monoclonal antibodies. Contour plots: x-axis, antibodies against total histone H3; y-axis, antibodies against H3K79me. Percentage of cells in each quadrant is shown.
Figure 2
Figure 2. Normalization of EpiTOF Data.
(A) Raw EpiTOF data. Mass cytometry analysis of control (DMSO) and Tazemetostat-treated Jurkat cells (top) or KMS11 and TKO1 cells (bottom) using the indicated antibodies. Contour plots: x-axis, antibodies against total histone H3; y-axis, antibodies against H3K27me3 (top) or H3K36me2 (bottom). Percentage of cells in each quadrant is shown. (B) Distributions of linear regression residuals of EpiTOF data. Histograms of linear regression residuals of the data in (A). x-axis, residual levels; y-axis, numbers of cells with given residual levels; top, H3K27me3 in DMSO (left)- or Tazemetostat (right)-treated Jurkat cells; bottom, H3K36me2 in KMS11 (left) or TKO1 (right) cells. (C) Normalized EpiTOF data. Box plots show the normalized H3K27me3 (top) or H3K36me2 (bottom) levels of the cells in (B). y-axis, normalized chromatin mark levels (residuals of a linear model using total H3 as predictor variable).
Figure 3
Figure 3. Data analysis and visualization of EpiTOF Data.
(A) Distinct chromatin modification profiles of immune cell subtypes. Heatmap representation of the normalized levels of 40 chromatin marks (x-axis) in three leukemia and lymphoma cell lines (y-axis). Color, normalized chromatin mark levels. Means of individual samples are used for plotting and are centered around the mean across all three samples. Warm colors, higher than the mean of all samples; cold color, lower than the means of all samples. Dendrograms, unsupervised clustering. (B and C) Segregations of single cells based on chromatin modification profiles. PCA (B) or t-SNE (C) analysis of EpiTOF data as in (A). Each dot represents a single cell. Color represents the sample to which individual cell belongs (red, U937; yellow, Jurkat; blue, OCI-Ly8). The first three principal components (B) or two t-SNE axes (C) computed from 20 chromatin marks are used to visualize the data. (D) Segregation of blood donors based on chromatin modification profiles. PCA of EpiTOF data collected from 5 healthy subjects. Each dot represents a single donor with label depicting the demographics. Principal components are calculated based on the levels of 40 chromatin marks in 11 immune cell subtypes (440 data points) from individual donors. The percentage of variance each principal component explains is shown. (D) Differential chromatin marks between CMV-seropositive and CMV-seronegative blood donors. Heatmap representation of the effect sizes of the levels of the indicated chromatin mark (x-axis) and immune cell subtype (y-axis) pairs in CMV-seropositive over CMV-seronegative donors. Dendrograms, unsupervised clusterings.

References

    1. Goldberg AD, Allis CD & Bernstein E Epigenetics: a landscape takes shape. Cell 128, 635–638, doi:10.1016/j.cell.2007.02.006 (2007). - DOI - PubMed
    1. Bogdanos DP et al. Twin studies in autoimmune disease: genetics, gender and environment. J Autoimmun 38, J156–169, doi:10.1016/j.jaut.2011.11.003 (2012). - DOI - PubMed
    1. Polderman TJ et al. Meta-analysis of the heritability of human traits based on fifty years of twin studies. Nat Genet 47, 702–709, doi:10.1038/ng.3285 (2015). - DOI - PubMed
    1. Allis CD & Jenuwein T The molecular hallmarks of epigenetic control. Nat Rev Genet 17, 487–500, doi:10.1038/nrg.2016.59 (2016). - DOI - PubMed
    1. Kouzarides T Chromatin modifications and their function. Cell 128, 693–705, doi:10.1016/j.cell.2007.02.005 (2007). - DOI - PubMed

Publication types

LinkOut - more resources