

Cousins at work: How combining medical with optical imaging enhances in vivo cell tracking
- PMID: 29960079
- PMCID: PMC6593261
- DOI: 10.1016/j.biocel.2018.06.008
Cousins at work: How combining medical with optical imaging enhances in vivo cell tracking
Abstract
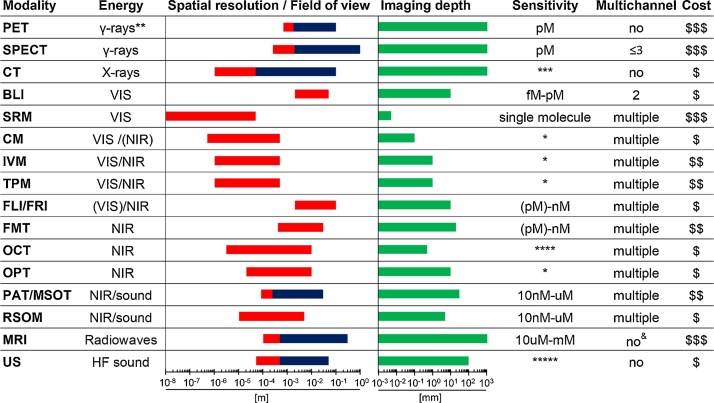
Microscopy and medical imaging are related in their exploitation of electromagnetic waves, but were developed to satisfy differing needs, namely to observe small objects or to look inside subjects/objects, respectively. Together, these techniques can help elucidate complex biological processes and better understand health and disease. A current major challenge is to delineate mechanisms governing cell migration and tissue invasion in organismal development, the immune system and in human diseases such as cancer where the spatiotemporal tracking of small cell numbers in live animal models is extremely challenging. Multi-modal multi-scale in vivo cell tracking integrates medical and optical imaging. Fuelled by basic research in cancer biology and cell-based therapeutics, it has been enabled by technological advances providing enhanced resolution, sensitivity and multiplexing capabilities. Here, we review which imaging modalities have been successfully used for in vivo cell tracking and how this challenging task has benefitted from combining macroscopic with microscopic techniques.
Keywords: Cancer metastasis; Cell therapy; Microscopy; Reporter genes; Whole-body imaging.
Copyright © 2018. Published by Elsevier Ltd.
Figures
Similar articles
-
Use of Nanoparticle Contrast Agents for Cell Tracking with Computed Tomography.Bioconjug Chem. 2017 Jun 21;28(6):1581-1597. doi: 10.1021/acs.bioconjchem.7b00194. Epub 2017 May 18. Bioconjug Chem. 2017. PMID: 28485976 Free PMC article. Review.
-
New imaging probes to track cell fate: reporter genes in stem cell research.Cell Mol Life Sci. 2017 Dec;74(24):4455-4469. doi: 10.1007/s00018-017-2584-z. Epub 2017 Jul 3. Cell Mol Life Sci. 2017. PMID: 28674728 Free PMC article. Review.
-
Discovering Macrophage Functions Using In Vivo Optical Imaging Techniques.Front Immunol. 2018 Mar 15;9:502. doi: 10.3389/fimmu.2018.00502. eCollection 2018. Front Immunol. 2018. PMID: 29599778 Free PMC article. Review.
-
Optical fluorescence imaging with shortwave infrared light emitter nanomaterials for in vivo cell tracking in regenerative medicine.J Cell Mol Med. 2019 Dec;23(12):7905-7918. doi: 10.1111/jcmm.14670. Epub 2019 Sep 27. J Cell Mol Med. 2019. PMID: 31559692 Free PMC article. Review.
-
Stem cell tracking: toward clinical application in oncology?Tumori. 2012 Sep-Oct;98(5):535-42. doi: 10.1177/030089161209800501. Tumori. 2012. PMID: 23235746 Review.
Cited by
-
Spatiotemporal PET Imaging Reveals Differences in CAR-T Tumor Retention in Triple-Negative Breast Cancer Models.Mol Ther. 2020 Oct 7;28(10):2271-2285. doi: 10.1016/j.ymthe.2020.06.028. Epub 2020 Jun 27. Mol Ther. 2020. PMID: 32645298 Free PMC article.
-
Direct Cell Radiolabeling for in Vivo Cell Tracking with PET and SPECT Imaging.Chem Rev. 2022 Jun 8;122(11):10266-10318. doi: 10.1021/acs.chemrev.1c00767. Epub 2022 May 12. Chem Rev. 2022. PMID: 35549242 Free PMC article. Review.
-
Nuclear-Based Labeling of Cellular Immunotherapies: A Simple Protocol for Preclinical Use.Mol Imaging Biol. 2024 Aug;26(4):555-568. doi: 10.1007/s11307-024-01923-z. Epub 2024 Jul 3. Mol Imaging Biol. 2024. PMID: 38958882 Free PMC article.
-
PET-based tracking of CAR T cells and viral gene transfer using a cell surface reporter that binds to lanthanide complexes.Nat Biomed Eng. 2025 Jun 13. doi: 10.1038/s41551-025-01415-7. Online ahead of print. Nat Biomed Eng. 2025. PMID: 40514433
-
Imaging of T-cell Responses in the Context of Cancer Immunotherapy.Cancer Immunol Res. 2021 May;9(5):490-502. doi: 10.1158/2326-6066.CIR-20-0678. Cancer Immunol Res. 2021. PMID: 33941536 Free PMC article. Review.
References
-
- Alanentalo T., Loren C.E., Larefalk A., Sharpe J., Holmberg D., Ahlgren U. High-resolution three-dimensional imaging of islet-infiltrate interactions based on optical projection tomography assessments of the intact adult mouse pancreas. J. Biomed. Opt. 2008;13:054070. - PubMed
Publication types
MeSH terms
Grants and funding
LinkOut - more resources
Full Text Sources
Other Literature Sources
Medical
