. 2018 Jul 25;7(1):49-62.e8.
doi: 10.1016/j.cels.2018.06.003. Epub 2018 Jun 27.

Four Key Steps Control Glycolytic Flux in Mammalian Cells

Affiliations

Four Key Steps Control Glycolytic Flux in Mammalian Cells

Lukas Bahati Tanner et al. Cell Syst. .

Abstract

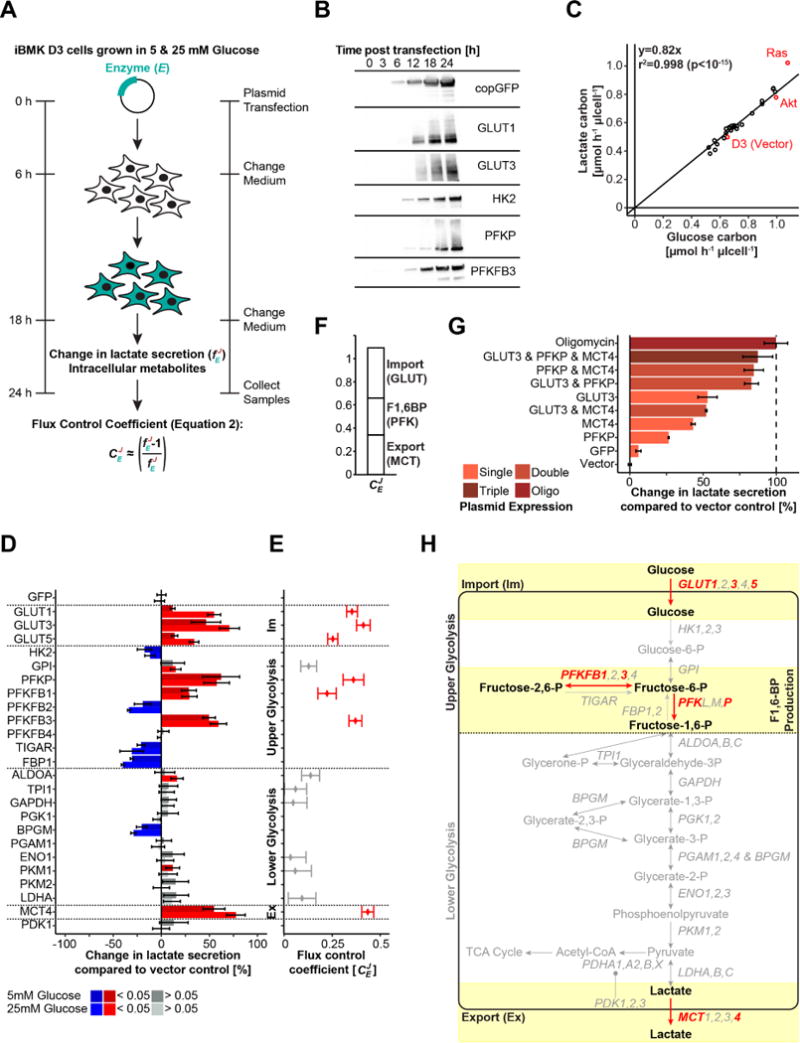
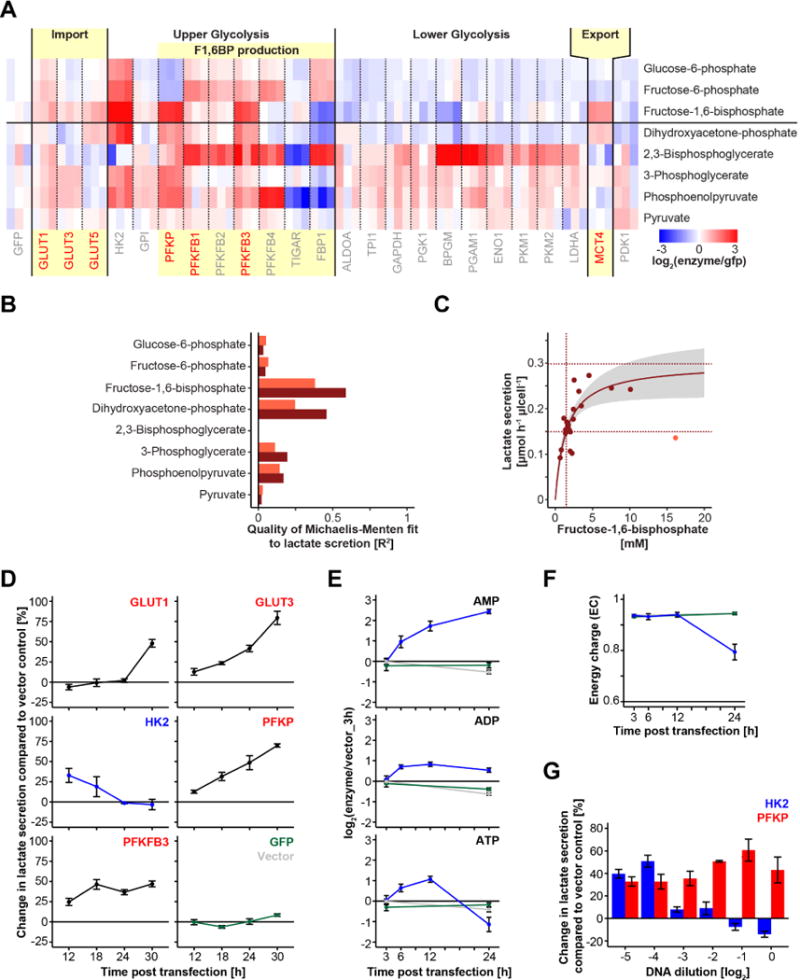
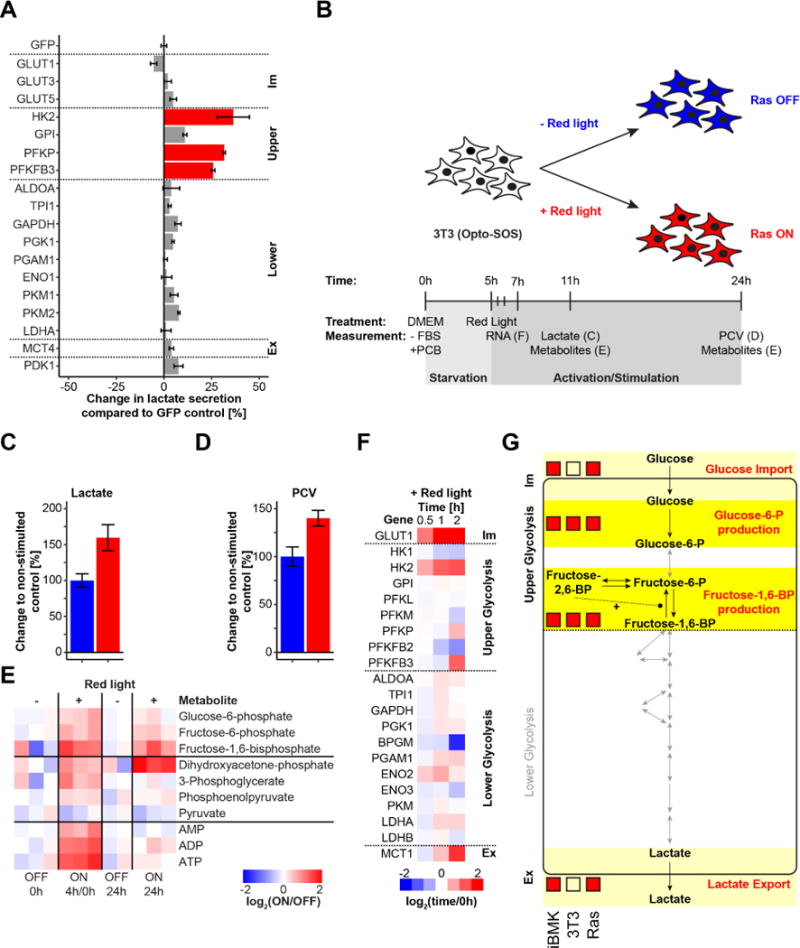
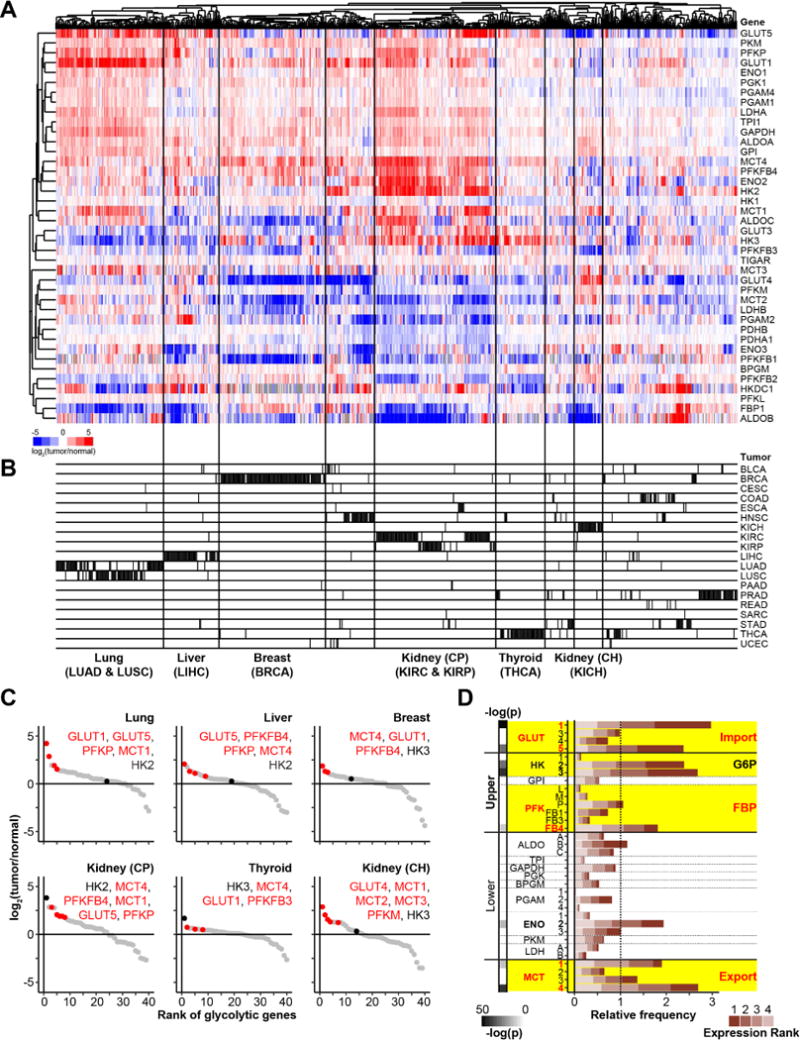
Altered glycolysis is a hallmark of diseases including diabetes and cancer. Despite intensive study of the contributions of individual glycolytic enzymes, systems-level analyses of flux control through glycolysis remain limited. Here, we overexpress in two mammalian cell lines the individual enzymes catalyzing each of the 12 steps linking extracellular glucose to excreted lactate, and find substantial flux control at four steps: glucose import, hexokinase, phosphofructokinase, and lactate export (and not at any steps of lower glycolysis). The four flux-controlling steps are specifically upregulated by the Ras oncogene: optogenetic Ras activation rapidly induces the transcription of isozymes catalyzing these four steps and enhances glycolysis. At least one isozyme catalyzing each of these four steps is consistently elevated in human tumors. Thus, in the studied contexts, flux control in glycolysis is concentrated in four key enzymatic steps. Upregulation of these steps in tumors likely underlies the Warburg effect.

Keywords: GLUT; MCT1; PFK; PFKFB; flux control; glycolysis; metabolic control analysis; metabolism; metabolomics; optogenetics.


Conflict of interest statement

DECLARATION OF INTERESTS

The authors declare no competing interests.

Figures

Figure 1
Figure 1. Glycolytic flux is controlled by glucose import, fructose-1,6-bisphopshate production, and lactate export
(A) Experimental setup used to determine glycolytic flux control. Enzymes were individually overexpressed in iBMK cells and change in lactate secretion (glycolytic flux) was assessed 24 h post transfection. (B) Western blot showing that the expression dynamics of different glycolytic enzymes is similar (see Figure S1 for additional enzymes). (C) Single glycolytic enzyme expression did not change the ratio of produced lactate to consumed glucose. Means of two biological replicates per condition are plotted. Parental, Akt, and Ras stably-expressing iBMK cells are colored in red. (D) Change in lactate secretion compared to vector control upon individual overexpression of glycolytic enzymes (in DMEM supplemented with 10% dFBS and 5 mM or 10 mM glucose as indicated) and (E) associated flux control coefficients according to the equation in A (for enzymes increasing glycolytic flux). Blue and red indicate statistically significant increases and decreases, respectively (q<0.05). Means and 95% confidence intervals (n≥6 biological replicates from at least two independent experiments) are plotted. (F) The sum of averaged flux control coefficients for glucose import (GLUT), FBP production (PFK), and lactate secretion (MCT) agrees with the summation theorem of metabolic control analysis. (G) Change in glycolytic flux upon combined overexpression of glucose transport (GLUT3), FBP production (PFKP), and lactate export (MCT4) in comparison to the glycolytic capacity measured upon oligomycin treatment. Data are means and 95% confidence intervals (n=3 biological replicates from one independent experiment; pTriple vs. Oligo>0.05; pTriple vs. GLUT3<0.01; pTriple vs. PFKP<0.01; pTriple vs. MCT4<0.02). (H) Cartoon highlighting in light yellow the experimentally determined glycolytic flux controlling steps. See also Figure S1.
Figure 2
Figure 2. Intracellular FBP levels mirror glycolytic flux
(A) Heat map summarizing changes in intracellular metabolite levels upon overexpression of glycolytic enzymes. Red and blue indicate increased and decreased intracellular metabolites, respectively. Light yellow colored boxes highlight the identified flux controlling steps from Figure 1. Glycolytic enzymes with positive glycolytic flux control are colored in red. (B) Quality of Michaelis-Menten fit of lactate secretion rate to the individual glycolytic intermediate concentration. Light brown shows R2 across all overexpressed constructs and dark brown represents R2 excluding HK2. R2 for fits were calculated by the residual sum of squares (RSS) and total sum of squares (TSS) with R2=1-RSS/TSS. (C) Absolute glycolytic flux as a function of FBP concentration follows Michaelis-Menten kinetics (p<10−4). Dark brown dotted lines indicate fitted Km (1.5 mM; p=0.002) and Vmax (0.3 μmol h−1 μl cell−1; p<10−8) values. Grey represents the 95% confidence intervals of the fitted function. Data from HK2 overexpressing cells is shown as the light brown dot and was omitted from the fitting. (D) Temporal dynamics of changes in lactate secretion upon single enzyme expression. (E) Adenosine phosphate levels upon HK2 overexpression (blue) compared to GFP (green) and vector control (grey) samples. (F) Energy charge upon HK2 overexpression. (G) Changes in lactate secretion as a function of DNA concentration. Means and 95% confidence intervals (n=3 biological replicates) are plotted in D, E, F and G. See also Figure S2.
Figure 3
Figure 3. Glycolytic flux increase upon Ras activation is controlled by glucose import, glucose-6-phosphate production, and lactate export
(A) Change in glycolytic flux in 3T3 cells upon individual overexpression of enzymes catalyzing every step in glycolysis. Means and 95% confidence intervals (n=3 biological replicates) are plotted. (B) Experimental setup to investigate acute metabolic perturbation in 3T3 cells upon optogenetic Ras activation. Changes in (C) lactate secretion at 6 h (n=12 biological replicates from two independent experiments; p<10−7) and (D) cell growth at 24 h (n=3 biological replicates; p<0.02) after red light exposure. Means and 95% confidence intervals are plotted. (E) Changes in intracellular metabolites 4 h and 24 h after activating red light exposure. The 4 h red light exposed time point was normalized to the mean of the 0 h time point; the stimulated (Ras ON) 24 h samples were normalized to the mean of the 24 h non-stimulated (Ras OFF) samples. (F) Gene expression dynamics of glycolytic enzymes (from RNAseq data) upon optogenetic Ras activation (Data was analyzed from a recent study (Wilson et al., 2017)). (G) Overview of results in iBMK and 3T3 cells. For the iBMK and 3T3 columns, red boxes indicate significant flux control based on enzyme overexpression experiments. For the Ras column, red boxes indicate significant transcriptional up-regulation upon acute optogenic Ras activation. See also Figure S3.
Figure 4
Figure 4. Increased glucose uptake, FBP production, and lactate export is a general hallmark of tumor metabolism
(A) Expression levels of glycolytic enzymes in solid tumor tissue samples compared to paired healthy tissue samples analyzed from TCGA data. (B) Clustering of tumor types based on glycolytic gene expression data only; Bladder Urothelial Carcinoma (BLCA), Breast invasive carcinoma (BRCA), Cervical squamous cell carcinoma and endocervical adenocarcinoma (CESC), Colon adenocarcinoma (COAD), Esophageal carcinoma (ESCA), Head and Neck squamous cell carcinoma (HNSC), Kidney Chromophobe (KICH), Kidney renal clear cell carcinoma (KIRC), Kidney renal papillary cell carcinoma (KIRP), Liver hepatocellular carcinoma (LIHC), Lung adenocarcinoma (LUAD), Lung squamous cell carcinoma (LUSC), Pancreatic adenocarcinoma (PAAD), Prostate adenocarcinoma (PRAD), Rectum adenocarcinoma (READ), Sarcoma (SARC), Stomach adenocarcinoma (STAD), Thyroid carcinoma (THCA), and Uterine Corpus Endometrial Carcinoma (UCEC). (C) Rank order of glycolytic genes from the most to the least expressed relative to benign adjacent tissue, on average, for different tumor types. Red represents top ranked gene isoform catalyzing glucose transport, FBP production and lactate export for each tumor type. Black indicates the highest expressed hexokinase isoform. (D) Relative frequencies with which gene isoforms across glycolysis are among the four most up-regulated glycolytic genes in an individual patient tumor. The expected frequency for each gene due to chance alone (78 occurances across 666 tumors) is defined as a relative frequency of 1. Statistically significant enrichment of a given gene isoform in the top four most up-regulated genes was calculated using a Fisher’s exact ttest with Bonferroni correction for multiple hypothesis testing (highlighted in bold). See also Figure S4, and Tables S2 and S3.

References

    1. Abdelmalek MF, Lazo M, Horska A, Bonekamp S, Lipkin EW, Balasubramanyam A, Bantle JP, Johnson RJ, Diehl AM, Clark JM, et al. Higher dietary fructose is associated with impaired hepatic adenosine triphosphate homeostasis in obese individuals with type 2 diabetes. Hepatology. 2012;56:952–960. - PMC - PubMed
    1. Abu-Amero KK, Alzahrani AS, Zou M, Shi Y. High frequency of somatic mitochondrial DNA mutations in human thyroid carcinomas and complex I respiratory defect in thyroid cancer cell lines. Oncogene. 2005;24:1455–1460. - PubMed
    1. Van Aelst L, Hohmann S, Bulaya B, de Koning W, Sierkstra L, Neves MJ, Luyten K, Alijo R, Ramos J, Coccetti P. Molecular cloning of a gene involved in glucose sensing in the yeast Saccharomyces cerevisiae. Mol Microbiol. 1993;8:927–943. - PubMed
    1. Afgan E, Baker D, van den Beek M, Blankenberg D, Bouvier D, Čech M, Chilton J, Clements D, Coraor N, Eberhard C, et al. The {Galaxy} platform for accessible, reproducible and collaborative biomedical analyses: 2016 update. Nucleic Acids Res. 2016;44:W3–W10. - PMC - PubMed
    1. Bensaad K, Tsuruta A, Selak MA, Vidal MNC, Nakano K, Bartrons R, Gottlieb E, Vousden KH. TIGAR, a p53-inducible regulator of glycolysis and apoptosis. Cell. 2006;126:107–120. - PubMed

Publication types