

An in vitro evaluation of turbulence after transcatheter aortic valve implantation
- PMID: 29961588
- PMCID: PMC6196367
- DOI: 10.1016/j.jtcvs.2018.05.042
An in vitro evaluation of turbulence after transcatheter aortic valve implantation
Abstract
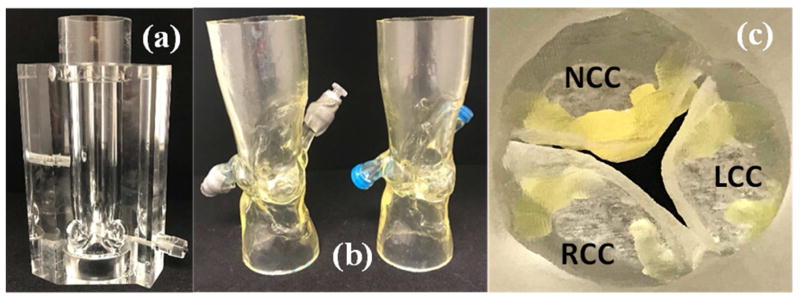
Background: This study aimed at assessment of post-transcatheter aortic valve (TAV) replacement hemodynamics and turbulence when a same-size SAPIEN 3 (Edwards Lifesciences Corp, Irvine, Calif) and Medtronic Evolut (Minneapolis, Minn) were implanted in a rigid aortic root with physiological dimensions and in a representative root with calcific leaflets obtained from patient computed tomography scans.
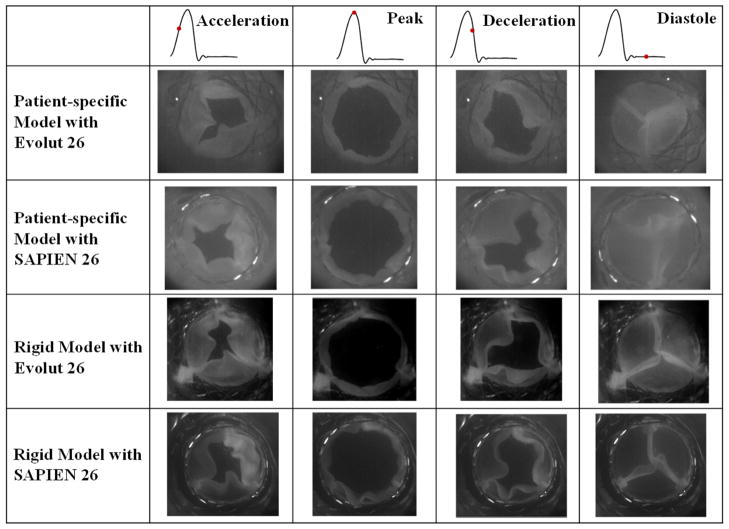
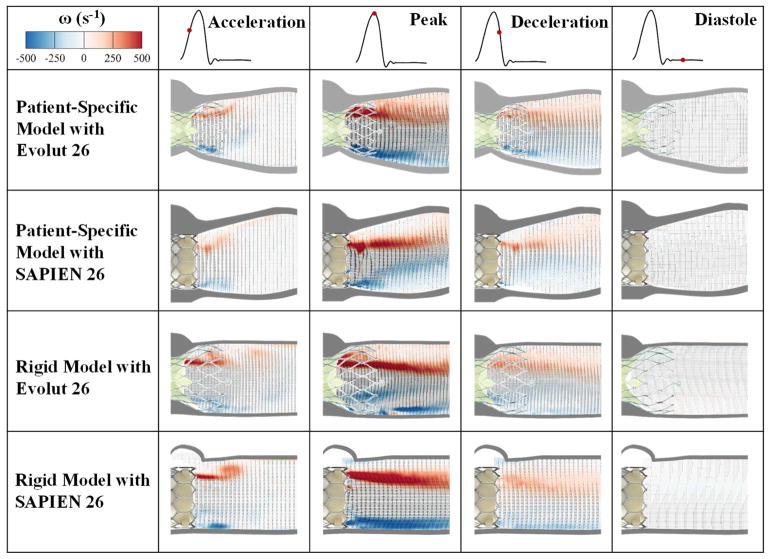
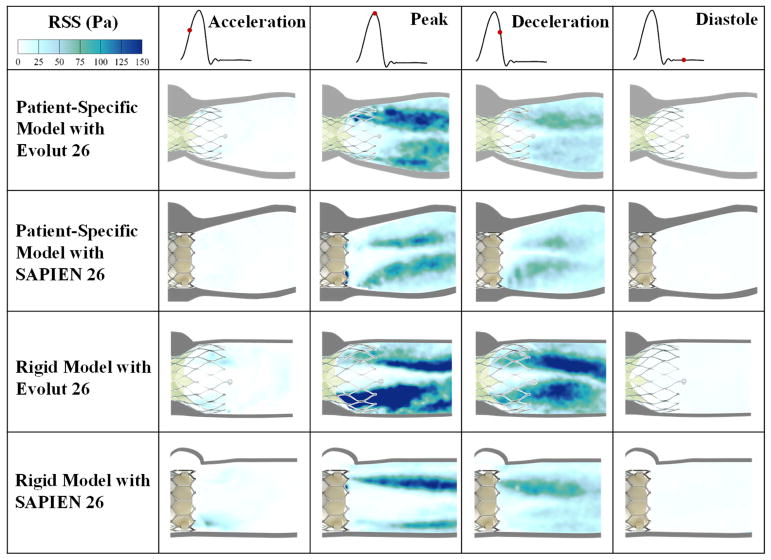
Methods: TAV hemodynamics were studied by placing a SAPIEN 3 26-mm and an Evolut 26-mm in rigid aortic roots and representative root with calcific leaflets under physiological conditions. Hemodynamics were assessed using high-fidelity particle image velocimetry and high-speed imaging. Transvalvular pressure gradients (PGs), pinwheeling indices, and Reynolds shear stress (RSS) were calculated.
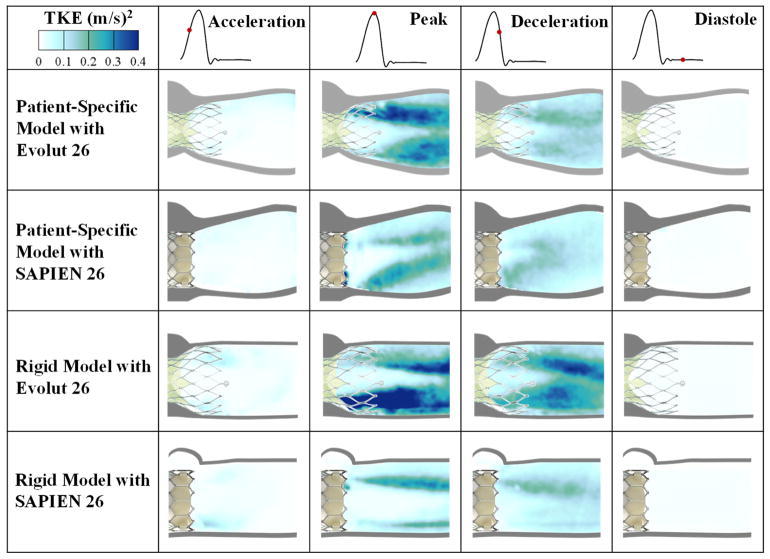
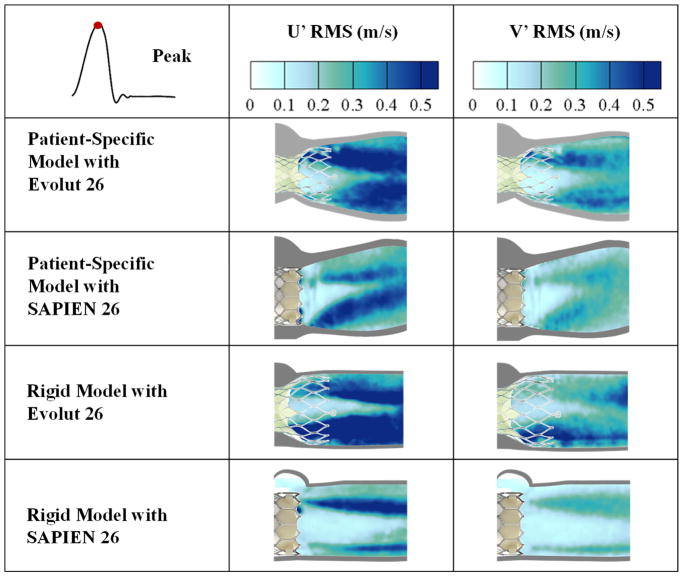
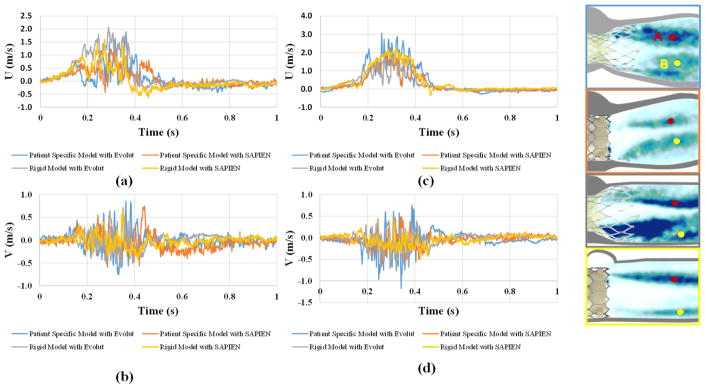
Results: (1) PGs obtained with the Evolut and the SAPIEN 3 were comparable among the different models (10.5 ± 0.15 mm Hg vs 7.76 ± 0.083 mm Hg in the rigid model along with 13.9 ± 0.19 mm Hg vs 5.0 ± 0.09 mm Hg in representative root with calcific leaflets obtained from patient computed tomography scans respectively); (2) more pinwheeling was found in the SAPIEN 3 than the Evolut (0.231 ± 0.057 vs 0.201 ± 0.05 in the representative root with calcific leaflets and 0.366 ± 0.067 vs 0.122 ± 0.045 in the rigid model); (3) higher rates of RSS were found in the Evolut (161.27 ± 3.45 vs 122.84 ± 1.76 Pa in representative root with calcific leaflets and 337.22 ± 7.05 vs 157.91 ± 1.80 Pa in rigid models). More lateral fluctuations were found in representative root with calcific leaflets.
Conclusions: (1) Comparable PGs were found among the TAVs in different models; (2) pinwheeling indices were found to be different between both TAVs; (3) turbulence patterns among both TAVs translated according to RSS were different. Rigid aortic models yield more conservative estimates of turbulence; (4) both TAVs exhibit peak maximal RSS that exceeds platelet activation 100 Pa threshold limit.
Keywords: hemodynamics; platelet activation; transcatheter aortic valve; turbulence.
Copyright © 2018 The American Association for Thoracic Surgery. Published by Elsevier Inc. All rights reserved.
Conflict of interest statement
Figures


Comment in
-
Transcatheter aortic valve replacement: Can we get through the turbulence?J Thorac Cardiovasc Surg. 2018 Nov;156(5):1849-1850. doi: 10.1016/j.jtcvs.2018.07.035. Epub 2018 Jul 26. J Thorac Cardiovasc Surg. 2018. PMID: 30119901 No abstract available.
References
-
- Padala M, Sarin EL, Willis P, et al. An engineering review of transcatheter aortic valve technologies. Cardiovascular Engineering and Technology. 2010;1:77–87.
-
- Rodés-Cabau J. Transcatheter aortic valve implantation: current and future approaches. Nature Reviews Cardiology. 2012;9:15. - PubMed
-
- Mylotte D, Piazza N. Transcatheter aortic valve replacement failure: deja vu ou jamais vu? Am Heart Assoc. 2015:1–4. - PubMed
Publication types
MeSH terms
Supplementary concepts
Grants and funding
LinkOut - more resources
Full Text Sources
Other Literature Sources
Medical
