Metabolic syndrome emerges after artificial selection for low baroreflex sensitivity
- PMID: 29962085
- PMCID: PMC6489946
- DOI: 10.1111/cns.12999
Metabolic syndrome emerges after artificial selection for low baroreflex sensitivity
Abstract
Aims: It is unclear whether the impaired BRS plays a key role in the incidence of cardiovascular diseases. The molecular mechanism of impaired BRS remains to be fully elucidated. We hypothesized that selection of rats based on deficient and normal intrinsic BRS would yield models that reflect cardiovascular diseases risk.
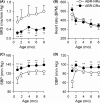
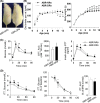
Methods and results: Twenty generations of selection produced arterial baroreflex low rats and normal rats that differed in BRS by about 2.5-fold change. Metabolic syndrome (including hypertension, overweight, hyperlipemia, and hyperglycemia) emerged in ABR-DRs. Although ABR-DRs consumed less food, they gained significantly more body weight.
Conclusion: Our study demonstrated that intrinsic low BRS induced hypertension and metabolic disorder. Restoration of impaired BRS might be a potent target of therapeutic intervention in metabolic syndrome.
Keywords: ABR-DRs; ABR-NRs; baroreflex sensitivity; hypertension; metabolic syndrome.
© 2018 John Wiley & Sons Ltd.
Conflict of interest statement
The authors declare no conflict of interest.
Figures


Similar articles
-
Baroreflex function: determinants in healthy subjects and disturbances in diabetes, obesity and metabolic syndrome.Curr Diabetes Rev. 2006 Aug;2(3):329-38. doi: 10.2174/157339906777950589. Curr Diabetes Rev. 2006. PMID: 18220637 Review.
-
Pregnancy impairs baroreflex control of heart rate in rats: role of insulin sensitivity.Am J Physiol Regul Integr Comp Physiol. 2010 Feb;298(2):R419-26. doi: 10.1152/ajpregu.00441.2009. Epub 2009 Nov 25. Am J Physiol Regul Integr Comp Physiol. 2010. PMID: 19939977 Free PMC article.
-
Arterial baroreflex: a novel target for preventing stroke in rat hypertension.Stroke. 2007 Jun;38(6):1916-23. doi: 10.1161/STROKEAHA.106.480061. Epub 2007 Apr 19. Stroke. 2007. PMID: 17446420
-
A method for assessment of the dynamic response of the arterial baroreflex.Acta Physiol (Oxf). 2018 Feb;222(2). doi: 10.1111/apha.12962. Epub 2017 Sep 26. Acta Physiol (Oxf). 2018. PMID: 28872781
-
Arterial baroreflex function in conscious rats.Acta Pharmacol Sin. 2002 Aug;23(8):673-9. Acta Pharmacol Sin. 2002. PMID: 12147187 Review.
Cited by
-
Interplay between baroreflex sensitivity, obesity and related cardiometabolic risk factors (Review).Exp Ther Med. 2022 Jan;23(1):67. doi: 10.3892/etm.2021.10990. Epub 2021 Nov 23. Exp Ther Med. 2022. PMID: 34934438 Free PMC article. Review.
-
TREML4 mRNA Expression and Polymorphisms in Blood Leukocytes are Associated with Atherosclerotic Lesion Extension in Coronary Artery Disease.Sci Rep. 2019 May 10;9(1):7229. doi: 10.1038/s41598-019-43745-y. Sci Rep. 2019. PMID: 31076644 Free PMC article.
-
Synergism of amlodipine and telmisartan or candesartan on blood pressure reduction by using SynergyFinder 3.0 and probability sum test in vivo.Pharmacol Res Perspect. 2023 Apr;11(2):e01064. doi: 10.1002/prp2.1064. Pharmacol Res Perspect. 2023. PMID: 36810974 Free PMC article.
-
Role of the central renin‑angiotensin system in hypertension (Review).Int J Mol Med. 2021 Jun;47(6):95. doi: 10.3892/ijmm.2021.4928. Epub 2021 Apr 13. Int J Mol Med. 2021. PMID: 33846799 Free PMC article. Review.
-
Natriuretic Peptides-New Targets for Neurocontrol of Blood Pressure via Baroreflex Afferent Pathway.Int J Mol Sci. 2022 Nov 7;23(21):13619. doi: 10.3390/ijms232113619. Int J Mol Sci. 2022. PMID: 36362405 Free PMC article.
References
-
- La Rovere MT, Christensen JH. The autonomic nervous system and cardiovascular disease: role of n‐3 PUFAs. Vascul Pharmacol. 2015;71:1‐10. - PubMed
-
- Ormezzano O, Cracowski JL, Quesada JL, Pierre H, Mallion JM, Baguet JP. EVAluation of the prognostic value of BARoreflex sensitivity in hypertensive patients: the EVABAR study. J Hypertens. 2008;26:1373‐1378. - PubMed
-
- La Rovere MT, Pinna GD, Hohnloser SH, et al. Baroreflex sensitivity and heart rate variability in the identification of patients at risk for life‐threatening arrhythmias: implications for clinical trials. Circulation. 2001;103:2072‐2077. - PubMed
-
- Robinson TG, Dawson SL, Eames PJ, Panerai RB, Potter JF. Cardiac baroreceptor sensitivity predicts long‐term outcome after acute ischemic stroke. Stroke. 2003;34:705‐712. - PubMed
-
- Mortara A, La Rovere MT, Pinna GD, et al. Arterial baroreflex modulation of heart rate in chronic heart failure: clinical and hemodynamic correlates and prognostic implications. Circulation. 1997;96:3450‐3458. - PubMed
Publication types
MeSH terms
LinkOut - more resources
Full Text Sources
Other Literature Sources
Medical

