

An evaluation of common methods for dichotomization of continuous variables to discriminate disease status
- PMID: 29962658
- PMCID: PMC6020169
- DOI: 10.1080/03610926.2016.1248783
An evaluation of common methods for dichotomization of continuous variables to discriminate disease status
Abstract
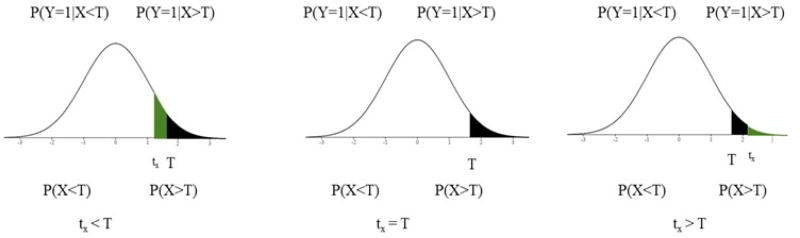
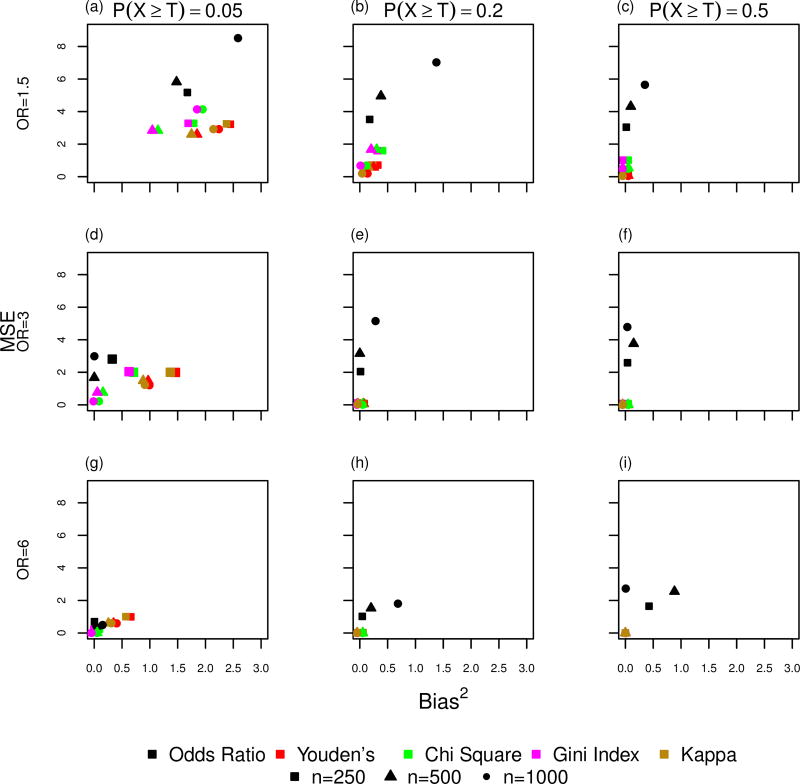
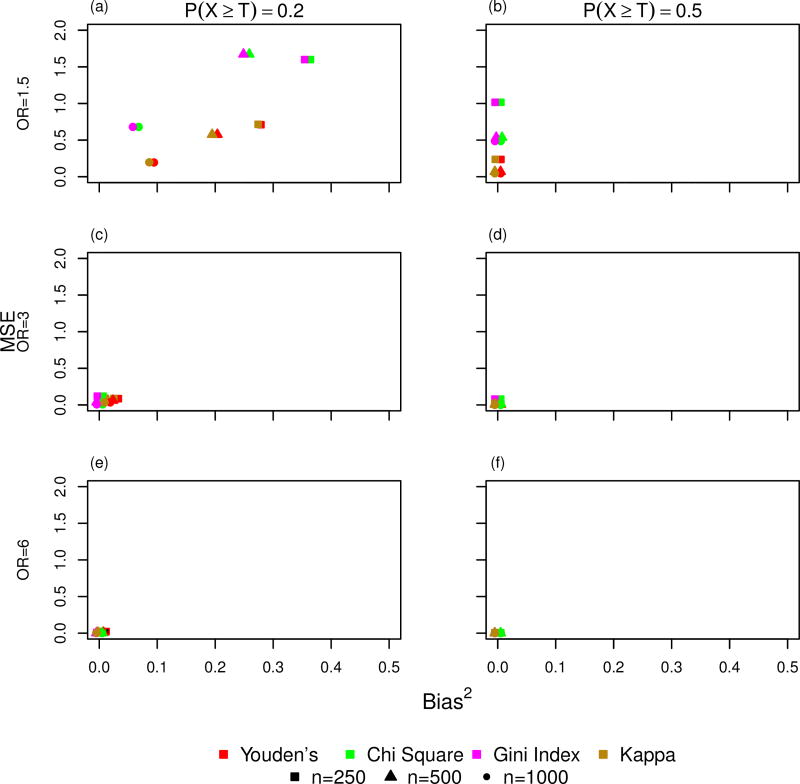
Dichotomization of continuous variables to discriminate a dichotomous outcome is often useful in statistical applications. If a true threshold for a continuous variable exists, the challenge is identifying it. This paper examines common methods for dichotomization to identify which ones recover a true threshold. We provide mathematical and numeric proofs demonstrating that maximizing the odds ratio, Youden's statistic, Gini Index, chi-square statistic, relative risk and kappa statistic all theoretically recover a true threshold. A simulation study evaluating the ability of these statistics to recover a threshold when sampling from a population indicates that maximizing the chi-square statistic and Gini Index have the smallest bias and variability when the probability of being larger than the threshold is small while maximizing Kappa or Youden's statistics is best when this probability is larger. Maximizing odds ratio is the most variable and biased of the methods.
Figures
References
-
- Alvarez-Garcıa G, Collantes-Fernandez E, Costas E, Rebordosa X, Ortega-Mora L. Influence of age and purpose for testing on the cut-off selection of serological methods in bovine neosporosis. Veterinary Research, BioMed Central. 2003;34(3):341–352. - PubMed
-
- Aoki K, Misumi J, Kimura T, Zhao W, Xie T. Evaluation of cutoff levels for screening of gastric cancer using serum pepsinogens and distributions of levels of serum pepsinogen i, ii and of pg i / pg ii ratios in a gastric cancer case-control study. Journal of Epidemiology. 1997;7(3):143–151. - PubMed
-
- Boehning D, Holling H, Patilea V. A limitation of the diagnostic-odds ratio in determining an optimal cut-off value for a continuous diagnostic test. Statistical Methods in Medical Research. 2011;20(5):541–550. - PubMed
-
- Bortheiry A, Malerbi D, Franco L. The roc curve in the evaluation of fasting capillary blood glucose as a screening test for diabetes and igt. Diabetes Care. 1994;17:1269–1272. - PubMed
-
- Breiman L, Friedman J, Stone C, Olshen R. Classification and regression trees. CRC press; 1984.
Grants and funding
LinkOut - more resources
Full Text Sources
Other Literature Sources