

Is It Better to Enter a Volume CT Dose Index Value before or after Scan Range Adjustment for Radiation Dose Optimization of Pediatric Cardiothoracic CT with Tube Current Modulation?
- PMID: 29962875
- PMCID: PMC6005958
- DOI: 10.3348/kjr.2018.19.4.692
Is It Better to Enter a Volume CT Dose Index Value before or after Scan Range Adjustment for Radiation Dose Optimization of Pediatric Cardiothoracic CT with Tube Current Modulation?
Abstract
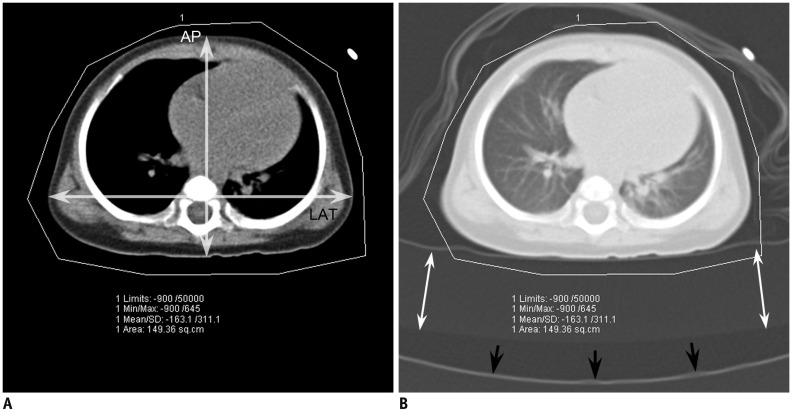
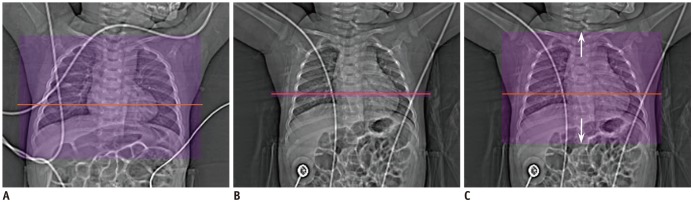
Objective: To determine whether the body size-adapted volume computed tomography (CT) dose index (CTDvol) in pediatric cardiothoracic CT with tube current modulation is better to be entered before or after scan range adjustment for radiation dose optimization.
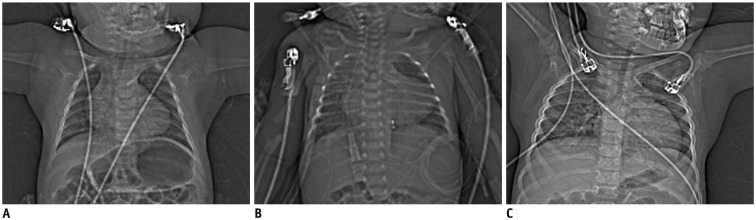
Materials and methods: In 83 patients, cardiothoracic CT with tube current modulation was performed with the body size-adapted CTDIvol entered after (group 1, n = 42) or before (group 2, n = 41) scan range adjustment. Patient-related, radiation dose, and image quality parameters were compared and correlated between the two groups.
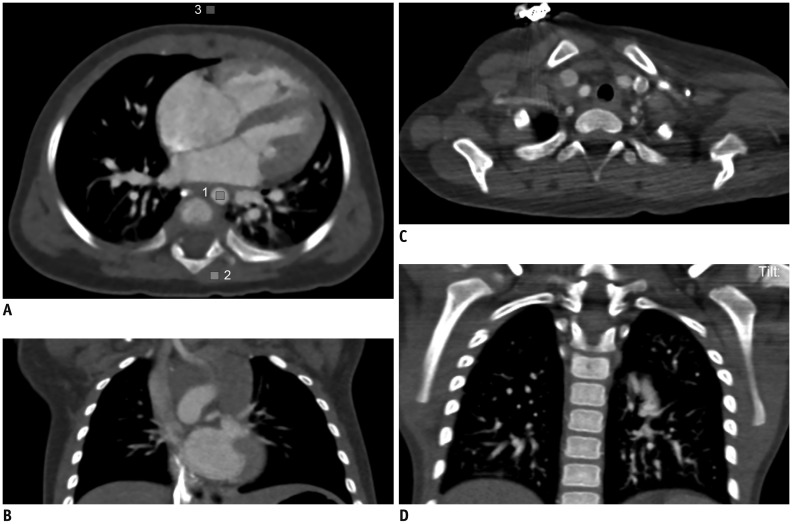
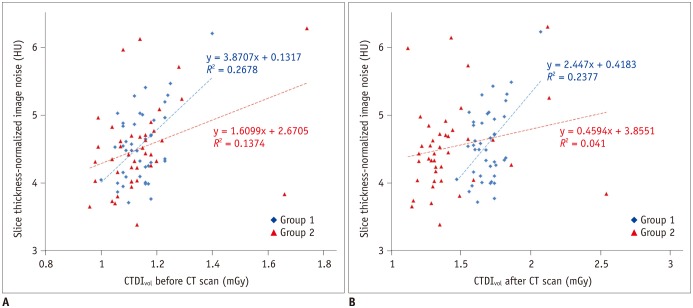
Results: The CTDIvol after the CT scan in group 1 was significantly higher than that in group 2 (1.7 ± 0.1 mGy vs. 1.4 ± 0.3 mGy; p < 0.0001). Image noise (4.6 ± 0.5 Hounsfield units [HU] vs. 4.5 ± 0.7 HU) and image quality (1.5 ± 0.6 vs. 1.5 ± 0.6) showed no significant differences between the two (p > 0.05). In both groups, all patient-related parameters, except body density, showed positive correlations (r = 0.49-0.94; p < 0.01) with the CTDIvol before and after the CT scan. The CTDIvol after CT scan showed modest positive correlation (r = 0.49; p ≤ 0.001) with image noise in group 1 but no significant correlation (p > 0.05) in group 2.
Conclusion: In pediatric cardiothoracic CT with tube current modulation, the CTDIvol entered before scan range adjustment provides a significant dose reduction (18%) with comparable image quality compared with that entered after scan range adjustment.
Keywords: Cardiac CT; Child; Image quality evaluation; Radiation dose optimization; Tube current modulation.
Figures
Similar articles
-
User-Friendly Vendor-Specific Guideline for Pediatric Cardiothoracic Computed Tomography Provided by the Asian Society of Cardiovascular Imaging Congenital Heart Disease Study Group: Part 1. Imaging Techniques.Korean J Radiol. 2019 Feb;20(2):190-204. doi: 10.3348/kjr.2018.0571. Korean J Radiol. 2019. PMID: 30672159 Free PMC article. Review.
-
Individualized volume CT dose index determined by cross-sectional area and mean density of the body to achieve uniform image noise of contrast-enhanced pediatric chest CT obtained at variable kV levels and with combined tube current modulation.Pediatr Radiol. 2011 Jul;41(7):839-47. doi: 10.1007/s00247-011-2121-4. Epub 2011 Jun 7. Pediatr Radiol. 2011. PMID: 21656275
-
A prospective evaluation of the contrast, radiation dose and image quality of contrast-enhanced CT scans of paediatric abdomens using a low-concentration iodinated contrast agent and low tube voltage combined with 70% ASIR algorithm.Int J Clin Pract. 2016 Sep;70 Suppl 9B:B16-21. doi: 10.1111/ijcp.12853. Int J Clin Pract. 2016. PMID: 27577509 Clinical Trial.
-
Spectral Beam Shaping in Unenhanced Chest CT Examinations: A Phantom Study on Dose Reduction and Image Quality.Acad Radiol. 2018 Feb;25(2):153-158. doi: 10.1016/j.acra.2017.08.011. Epub 2017 Oct 18. Acad Radiol. 2018. PMID: 29055683
-
CT dose reduction in children.Eur Radiol. 2005 Nov;15(11):2330-40. doi: 10.1007/s00330-005-2856-0. Epub 2005 Aug 10. Eur Radiol. 2005. PMID: 16091948 Review.
Cited by
-
Pulmonary Atresia with Intact Ventricular Septum: Correlation of Preoperative Computed Tomography-Derived Parameters with Echocardiographic Tricuspid Valve Z-Score and Surgical Outcomes.Pediatr Cardiol. 2025 Aug;46(6):1560-1569. doi: 10.1007/s00246-024-03570-1. Epub 2024 Jul 2. Pediatr Cardiol. 2025. PMID: 38953951
-
Pragmatic Approaches to Reducing Radiation Dose in Brain Computed Tomography Scan using Scan Parameter Modification.J Med Signals Sens. 2022 Jul 26;12(3):219-226. doi: 10.4103/jmss.JMSS_83_20. eCollection 2022 Jul-Sep. J Med Signals Sens. 2022. PMID: 36120405 Free PMC article.
-
User-Friendly Vendor-Specific Guideline for Pediatric Cardiothoracic Computed Tomography Provided by the Asian Society of Cardiovascular Imaging Congenital Heart Disease Study Group: Part 1. Imaging Techniques.Korean J Radiol. 2019 Feb;20(2):190-204. doi: 10.3348/kjr.2018.0571. Korean J Radiol. 2019. PMID: 30672159 Free PMC article. Review.
-
Quantification of Initial Right Ventricular Dimensions by Computed Tomography in Infants with Congenital Heart Disease and a Hypoplastic Right Ventricle.Korean J Radiol. 2020 Feb;21(2):203-209. doi: 10.3348/kjr.2019.0662. Korean J Radiol. 2020. PMID: 31997595 Free PMC article.
-
Coronary artery anomalies on preoperative cardiac CT in children with tetralogy of Fallot or Fallot type of double outlet right ventricle: comparison with surgical findings.Int J Cardiovasc Imaging. 2018 Dec;34(12):1997-2009. doi: 10.1007/s10554-018-1422-1. Epub 2018 Jul 26. Int J Cardiovasc Imaging. 2018. PMID: 30051301
References
-
- Greenwood TJ, Lopez-Costa RI, Rhoades PD, Ramírez-Giraldo JC, Starr M, Street M, et al. CT dose optimization in pediatric radiology: a multiyear effort to preserve the benefits of imaging while reducing the risks. Radiographics. 2015;35:1539–1554. - PubMed
-
- Greess H, Lutze J, Nömayr A, Wolf H, Hothorn T, Kalender WA, et al. Dose reduction in subsecond multislice spiral CT examination of children by online tube current modulation. Eur Radiol. 2004;14:995–999. - PubMed
-
- Goo HW, Suh DS. Tube current reduction in pediatric non-ECG-gated heart CT by combined tube current modulation. Pediatr Radiol. 2006;36:344–351. - PubMed
MeSH terms
LinkOut - more resources
Full Text Sources
Other Literature Sources
Medical
