. 2018 Jun 15:12:407.
doi: 10.3389/fnins.2018.00407. eCollection 2018.

Big Data Analysis of Genes Associated With Neuropsychiatric Disorders in an Alzheimer's Disease Animal Model

Affiliations

Big Data Analysis of Genes Associated With Neuropsychiatric Disorders in an Alzheimer's Disease Animal Model

Suji Ham et al. Front Neurosci. .

Abstract

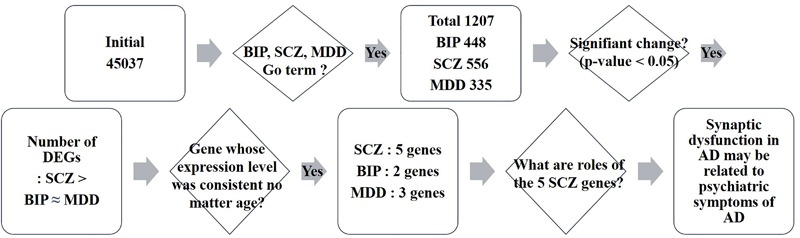
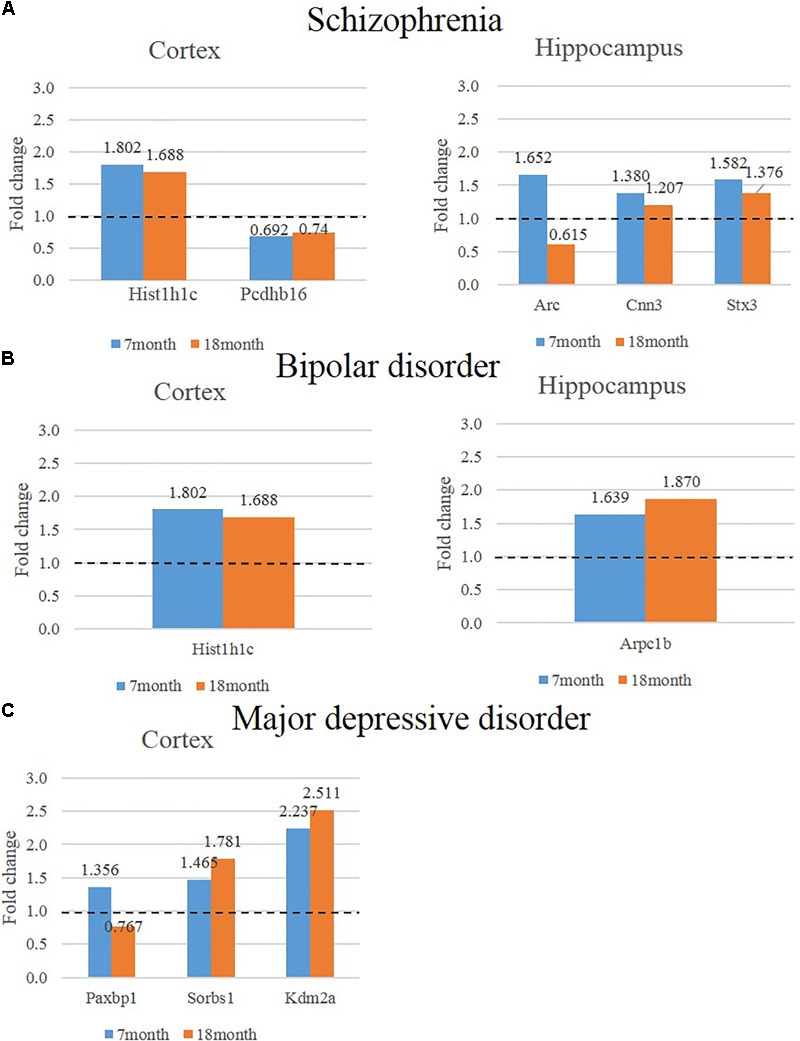
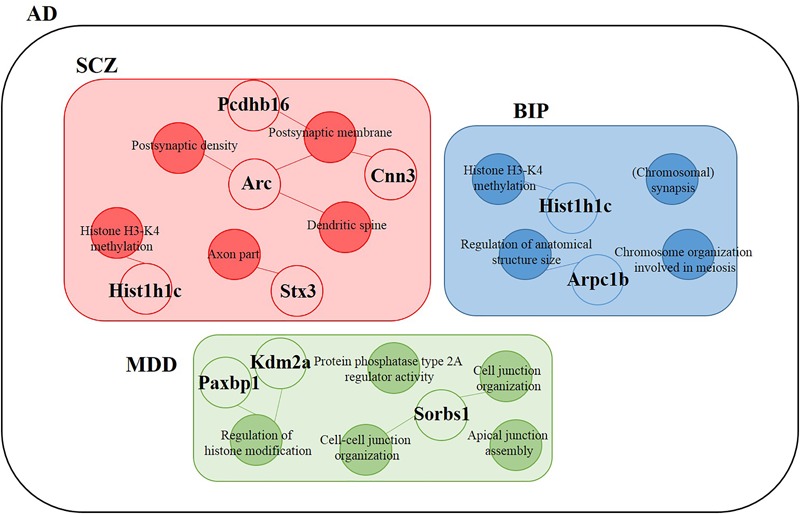
Alzheimer's disease is a neurodegenerative disease characterized by the impairment of cognitive function and loss of memory, affecting millions of individuals worldwide. With the dramatic increase in the prevalence of Alzheimer's disease, it is expected to impose extensive public health and economic burden. However, this burden is particularly heavy on the caregivers of Alzheimer's disease patients eliciting neuropsychiatric symptoms that include mood swings, hallucinations, and depression. Interestingly, these neuropsychiatric symptoms are shared across symptoms of bipolar disorder, schizophrenia, and major depression disorder. Despite the similarities in symptomatology, comorbidities of Alzheimer's disease and these neuropsychiatric disorders have not been studied in the Alzheimer's disease model. Here, we explore the comprehensive changes in gene expression of genes that are associated with bipolar disorder, schizophrenia, and major depression disorder through the microarray of an Alzheimer's disease animal model, the forebrain specific PSEN double knockout mouse. To analyze the genes related with these three neuropsychiatric disorders within the scope of our microarray data, we used selected 1207 of a total of 45,037 genes that satisfied our selection criteria. These genes were selected on the basis of 14 Gene Ontology terms significantly relevant with the three disorders which were identified by previous research conducted by the Psychiatric Genomics Consortium. Our study revealed that the forebrain specific deletion of Alzheimer's disease genes can significantly alter neuropsychiatric disorder associated genes. Most importantly, most of these significantly altered genes were found to be involved with schizophrenia. Taken together, we suggest that the synaptic dysfunction by mutation of Alzheimer's disease genes can lead to the manifestation of not only memory loss and impairments in cognition, but also neuropsychiatric symptoms.

Keywords: Alzheimer’s disease; big data; bipolar disorder; major depression disorder; microarray; neuropsychiatric symptoms; schizophrenia.


Figures

FIGURE 1
FIGURE 1
Schematic flow of big data analysis. Rectangles indicate the result of each step of microarray analysis. The phrase “Initial 45037” denotes the number of probes in the microarray. Rhombus denotes a criteria or question asked in each step. DEG: differentially expressed genes.
FIGURE 2
FIGURE 2
Overall comparison of significantly altered genes in the cortex of AD model within GO terms of BIP, SCZ, and MDD. Various shades of blue indicate BIP GO terms. Various shades of red indicate SCZ GO terms. Various shades of green indicate BIP terms. The bar graph represents the percent of significantly changed genes based on the total number of genes within each GO terms. The pie chart represents the number of significantly altered genes within each GO terms. (A) and (B) have resulted from analysis in the cortex of 7 month aged AD mice. (C) and (D) resulted from the cortex of 18-month old AD mice. Methylation: Histone H3-K4 methylation; Synapsis: (Chromosomal) synapsis; Structure: Regulation of anatomical structure size; Meiosis: Chromosome organization involved in meiosis; PSD: Postsynaptic density; PSM: Postsynaptic membrane; Spine: Dendritic spine; Axon: Axon part; Phosphatase: Protein phosphatase type 2A regulator activity; Cell junction : Cell junction organization; Apical junction: Apical junction assembly; Cell-cell junction: Cell-cell junction organization; Histone modification: Regulation of histone modification.
FIGURE 3
FIGURE 3
Overall comparison of significantly altered genes in the hippocampus of AD model within GO terms of BIP, SCZ, and MDD. Various shades of blue indicate BIP GO terms. Various shades of red indicates SCZ GO terms. Various shades of green indicate BIP terms. The bar graph represents the percent of significantly changed genes based on the total number of genes within each GO terms. The pie chart represent the number of significantly altered genes within each GO terms. (A) and (B) resulted from analysis in the hippocampus of 7-month old AD mice. (C) and (D) resulted from the hippocampus of 18-month old AD mice. Methylation: Histone H3-K4 methylation; Synapsis: (Chromosomal) synapsis; Structure: Regulation of anatomical structure size; Meiosis: Chromosome organization involved in meiosis; PSD: Postsynaptic density; PSM: Postsynaptic membrane; Spine: Dendritic spine; Axon: Axon part; Phosphatase: Protein phosphatase type 2A regulator activity; Cell junction : Cell junction organization; Apical junction: Apical junction assembly; Cell-cell junction: Cell-cell junction organization; Histone modification: Regulation of histone modification.
FIGURE 4
FIGURE 4
Venn diagram displaying numbers of upregulated and downregulated SCZ-associated genes in AD animal model. The left Venn diagrams show differently expressed cortical mRNAs of AD mice compared to control mice and the right Venn diagrams show differently expressed hippocampal mRNAs of AD mice compared to control mice (P-value < 0.05, Fold change > 1.3). (A) The number of significantly altered genes within five GO terms associated with SCZ. (B) The number of significantly altered genes within four GO terms associated with BIP. (C) The number of significantly altered genes within five GO terms associated with MDD. Italicization denotes the number of up-regulated genes and an underline denotes the number of down-regulated genes. Numbers in red indicate the number of contra-regulated genes that are upregulated in one group and downregulated in another group.
FIGURE 5
FIGURE 5
Expression of genes that show consistently significant alterations in two different ages (7, 18 months) of AD animal model. The left graph shows consistently altered cortical mRNAs in two different ages (7, 18 months) of AD mice compared to control mice and the graph on the right shows consistently altered cortical mRNAs in two different ages of AD mice compared to control (P-value < 0.05, Fold change > 1.3). (A) The expression of SCZ associated genes in the cortex is indicated in the bar graph on the left and hippocampus is indicated in the graph on the right. (B) The expression of BIP associated genes in the cortex is indicated in the bar graph on the left and hippocampus is indicated in the graph on the right. (C) The expression of MDD associated genes in the cortex is indicated in the bar graph on the left and hippocampus is indicated in the graph on the right.
FIGURE 6
FIGURE 6
Differentially expressed genes within GO terms of BIP, SCZ, and MDD. The SCZ associated genes (Hist1h1c, Pcdhb16, Arc, Cnn3, and Stx3) belonged to Postsynaptic density (Arc, Cnn3), Postsynaptic membrane (Pcdhb16, Arc), Dendritic spine (Arc, Cnn3), Histone H3-K4 methylation (Hist1h1c), and Axon part (Stx3). The BIP associated genes (Hist1h1c and Arpc1b) belonged to Histone H3-K4 methylation and Regulation of anatomical structure size, respectively. The MDD-associated genes (Paxbp1, Sorbs1, and Kdm2a) belonged to Cell junction organization, Cell-cell junction organization, and Regulation of histone modification. Empty circles indicate genes and filled circles indicate GO terms. The lines between empty and filled circles denote that the gene belongs to the GO terms.

References

    1. Amad A., Cachia A., Gorwood P., Pins D., Delmaire C., Rolland B., et al. (2014). The multimodal connectivity of the hippocampal complex in auditory and visual hallucinations. Mol. Psychiatry 19 184–191. 10.1038/mp.2012.181 - DOI - PubMed
    1. Binns D., Dimmer E., Huntley R., Barrell D., O’Donovan C., Apweiler R. (2009). QuickGO: a web-based tool for Gene Ontology searching. Bioinformatics 25 3045–3046. 10.1093/bioinformatics/btp536 - DOI - PMC - PubMed
    1. Buchanan S. M., Schalm S. S., Maniatis T. (2010). Proteolytic processing of protocadherin proteins requires endocytosis. Proc. Natl. Acad. Sci. U.S.A. 107 17774–17779. 10.1073/pnas.1013105107 - DOI - PMC - PubMed
    1. Diao Y., Guo X., Li Y., Sun K., Lu L., Jiang L., et al. (2012). Pax3/7BP is a Pax7- and Pax3-binding protein that regulates the proliferation of muscle precursor cells by an epigenetic mechanism. Cell Stem Cell 11 231–241. 10.1016/j.stem.2012.05.022 - DOI - PubMed
    1. Frodl T., Schaub A., Banac S., Charypar M., Jager M., Kummler P., et al. (2006). Reduced hippocampal volume correlates with executive dysfunctioning in major depression. J. Psychiatry Neurosci. 31 316–323. - PMC - PubMed