. 2018 Jun 14:9:447.
doi: 10.3389/fneur.2018.00447. eCollection 2018.

Intermittent Hypoxia Induced Formation of "Endothelial Cell-Colony Forming Units (EC-CFUs)" Is Affected by ROS and Oxidative Stress

Affiliations

Intermittent Hypoxia Induced Formation of "Endothelial Cell-Colony Forming Units (EC-CFUs)" Is Affected by ROS and Oxidative Stress

Katia Avezov et al. Front Neurol. .

Abstract

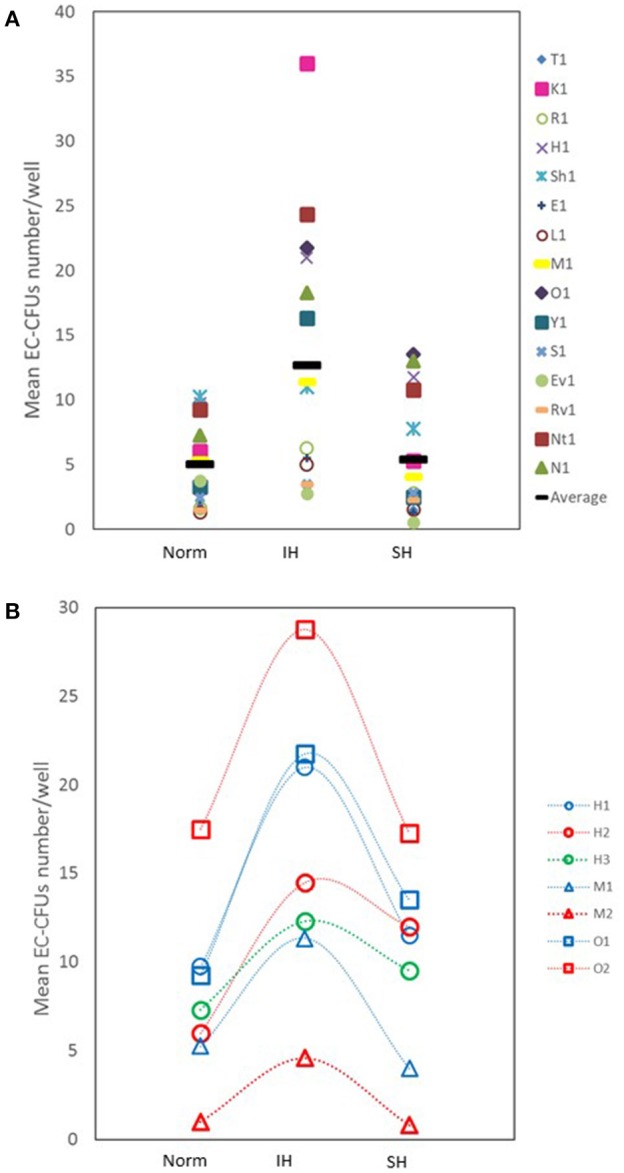
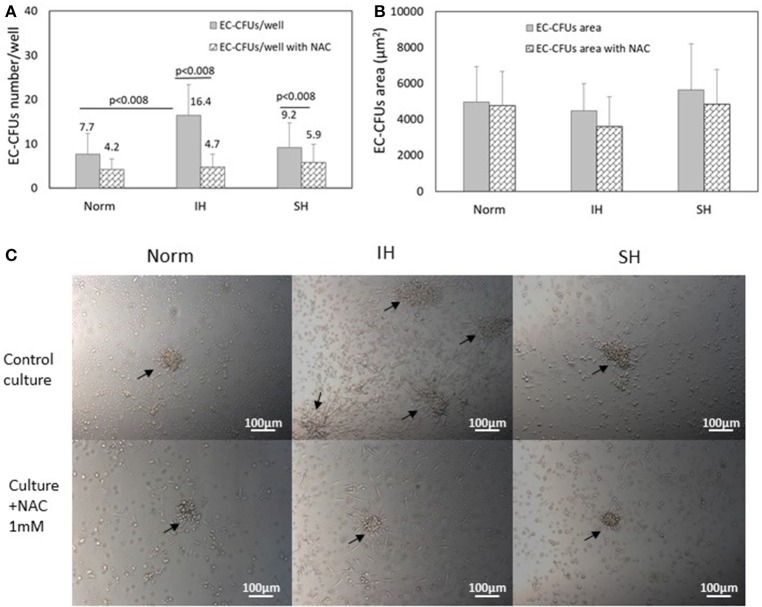
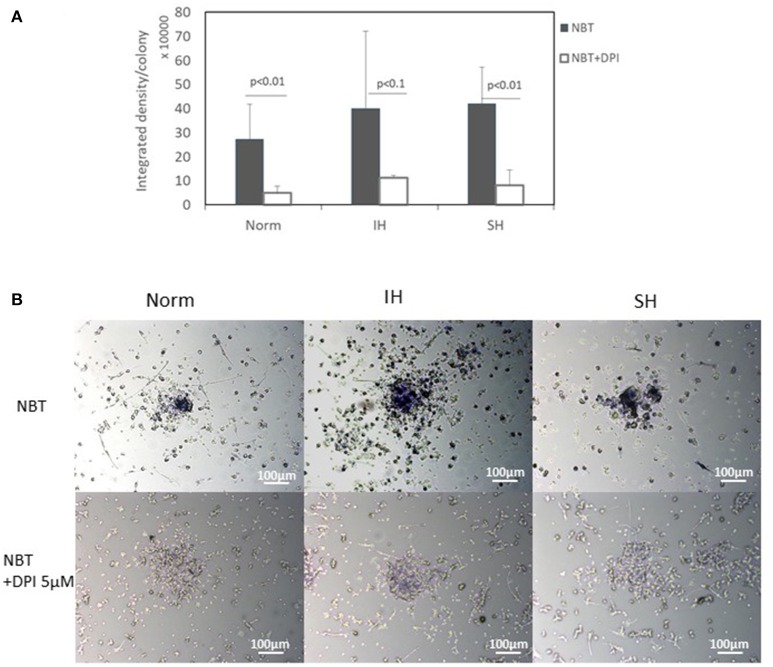
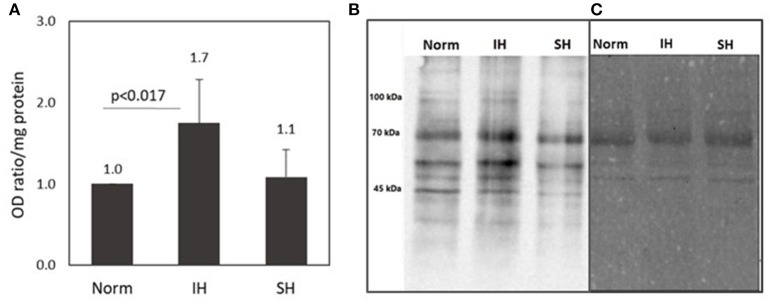
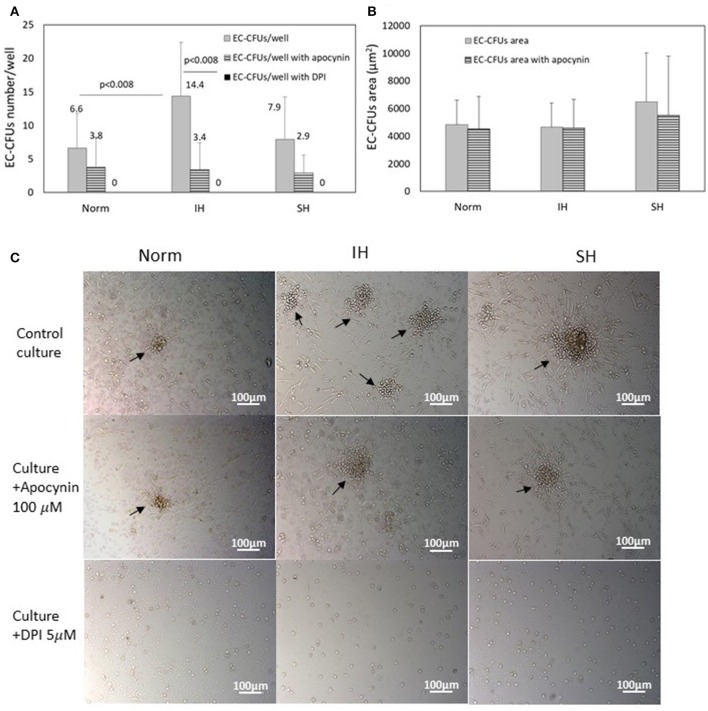
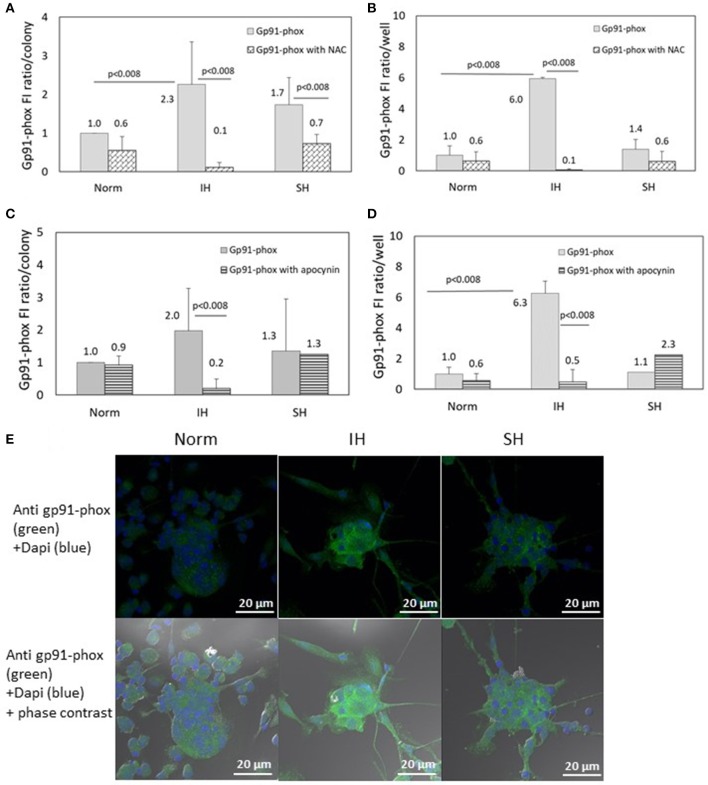
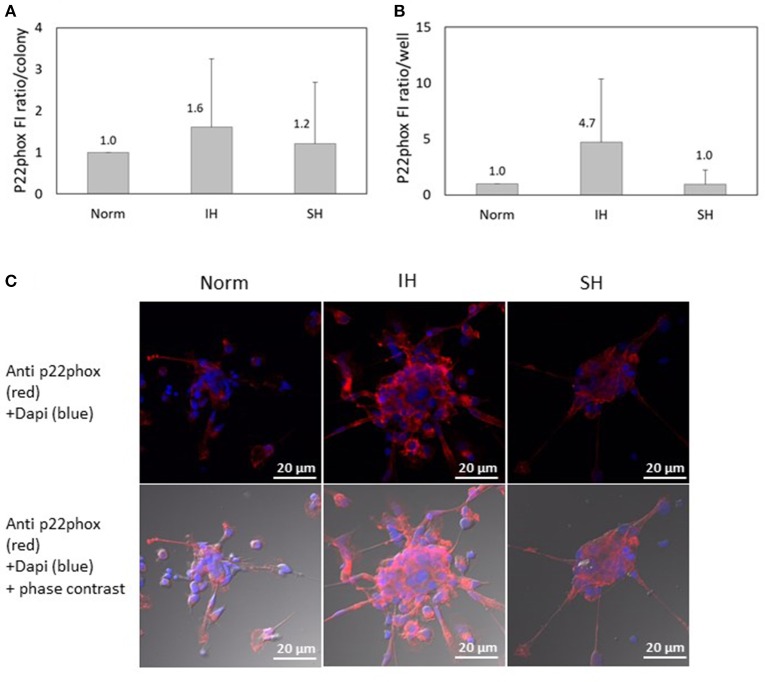
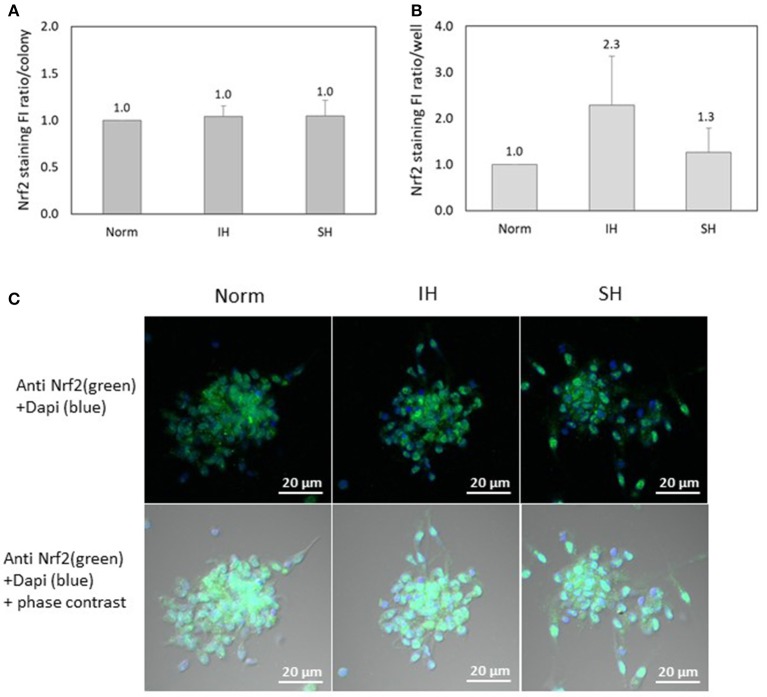
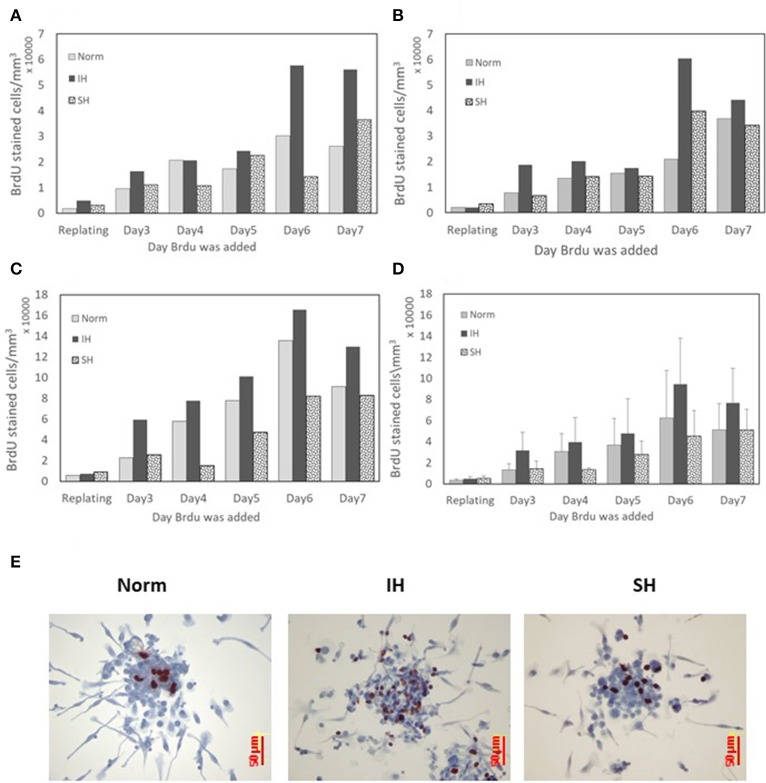
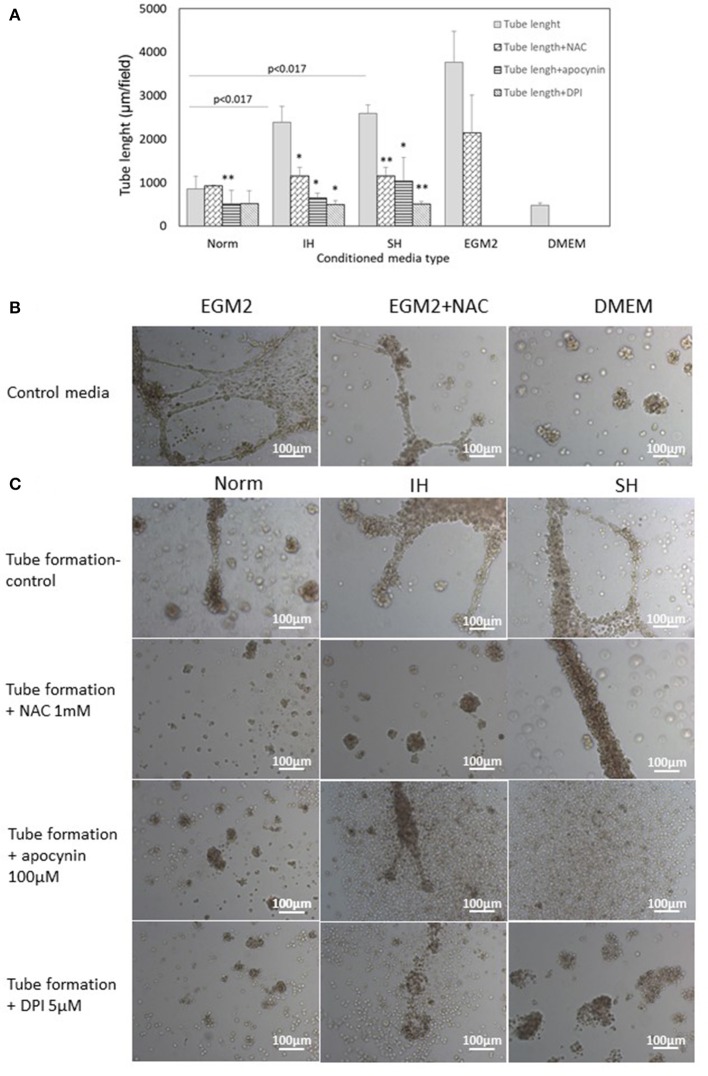
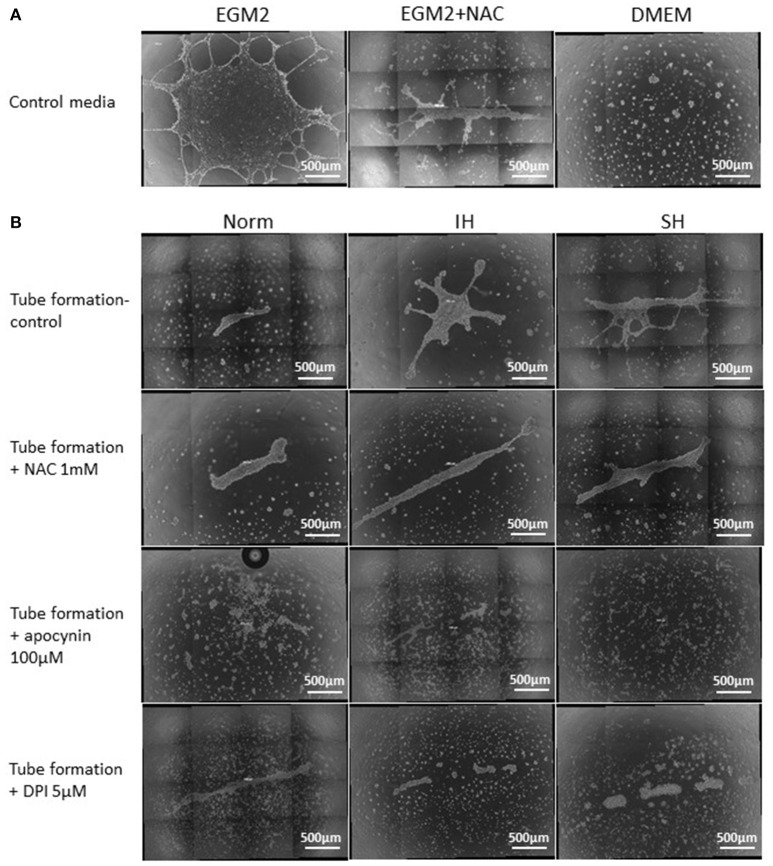
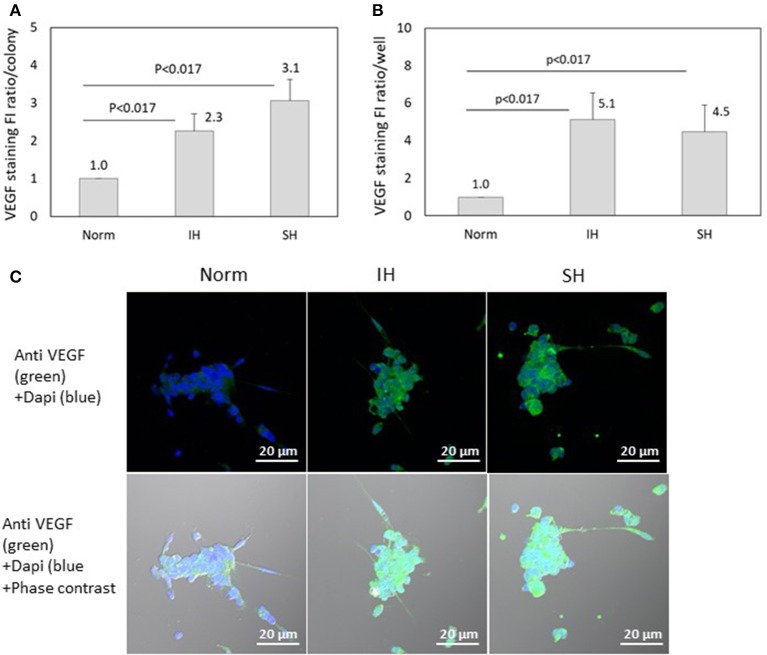
Intermittent hypoxia (IH)-the hallmark of obstructive sleep apnea (OSA)-increases leukocyte activation, production of NADPH-oxidase dependent reactive oxygen species (ROS) and oxidative stress, affecting endothelial function. However, IH and oxidative stress can also stimulate adaptive-protective mechanisms by inducing the development of Endothelial Cell-Colony Forming Units (EC-CFUs), which are considered as a good surrogate marker for endothelial progenitor cells (EPCs), and likely reflect a reparatory response to vascular damage or tissue ischemia by leukocytes. Blood samples were obtained from 15 healthy consenting volunteers to evaluate the effects of IH and sustained hypoxia (SH) in vitro on EC-CFUs development and functions. The variables measured included: their numbers, the area, the proliferative capacity and ROS production. Additionally, NADPH-oxidase, VEGF and nuclear factor-erythroid 2 related factor 2 (Nrf2) expression, as well as their paracrine effects on endothelial tube formation were determined. The involvement of ROS was probed using the anti-oxidant N-acetylcysteine (NAC) and NADPH-oxidase inhibitors apocynin and diphenyl-iodide. Compared to normoxia, IH-dependent increases in EC-CFUs numbers were observed, showing an individual donor-dependent trait. Also, the expression of VEGF and gp91phox, a subunit of NADPH-oxidase, were significantly increased. ROS production and oxidative stress markers were also significantly increased, but Nrf2 expression and colony size were unaffected by IH. Additionally, conditioned media harvested from IH- and SH-treated mature EC-CFUs, significantly increased endothelial tube formation. These effects were markedly attenuated or diminished by the ROS and NADPH-oxidase inhibitors employed. In conclusion, we show here for the first time that IH-associated oxidative stress promotes EC-CFUs' vascular and paracrine capacities through ROS. However, the large inter-individual variability expressed in EC-CFUs numbers and functions to a given IH stimulus, may represent an individual trait with a potential clinical significance.

Keywords: N-acetylcysteine; NADPH oxidase inhibitors; endothelial cell-colony forming units (EC-CFUs); endothelial tube formation; intermittent hypoxia; obstructive sleep apnea; oxidative-stress.


Figures

Figure 1
Figure 1
The effects of intermittent and sustained hypoxia, in vitro, on EC-CFUs numbers. (A) Individual and mean EC-CFUs numbers on the 7th day in culture (n = 15). The cells were exposed for three consecutive days to 14 intermittent hypoxia (IH) cycles, or to 6 h sustained (SH) hypoxia per day and compared to normoxia (Norm), as described in Methods. Each symbol represents a different donor. The horizontal bar represents the average value for each treatment. (IH 12.7 ± 10 vs. Norm 5 ± 3.3 EC-CFUs/well, p < 0.017; Norm vs. SH 5.4 ± 4.7 EC-CFU/well, p = NS). (B) EC-CFUs formation under Norm, IH and SH, in three donors who were tested two to three times. The first, the second, and the third (where available) tests were plotted (H1, patient H first test; H2, patient H second test; H3, patient H third test).
Figure 2
Figure 2
The effects of intermittent and sustained hypoxia, in vitro on EC-CFUs numbers and colony area with and without N-acetylcysteine. (A) Mean EC-CFUs numbers on the 7th day in culture with and without 1 mM N-acetylcysteine (NAC) (n = 9). The cells were exposed for 3 days to 14 intermittent hypoxia (IH) cycles per day (approximately 6 h/day) or to sustained hypoxia (SH) for an equal time per day and compared to normoxia (Norm), as described in Methods. In additional experiments, cells were exposed to 1 mM NAC concomitantly with Norm, IH and SH. (p < 0.008 for: Norm vs. IH; IH vs. IH+NAC; SH vs. SH+NAC). (B) Mean EC-CFUs size on the 7th day in culture with and without 1 mM NAC (n = 9) was unaffected. No significant differences were found between the areas of EC-CFUs treated with various oxygen treatments or with NAC. (C) Representative photomicrographs of EC-CFUs microscopic fields (X10) for Norm, IH and SH with and without 1 mM NAC. EC-CFUs colonies are shown by arrows.
Figure 3
Figure 3
Production of Reactive oxygen species (ROS) by EC-CFUs under normoxia, intermittent and sustained hypoxia with and without diphenyl iodide (DPI). Production of ROS per colony was measured by the nitro blue tetrazolium (NBT) test with and without the NADPH oxidase inhibitor DPI (5 μM) (n = 3). The test depends on the direct reduction of NBT into an insoluble blue formazan compound by NADPH oxidase. Cytoplasmic clumps of formazan deposits are considered positive for ROS. The blue score positively correlates with cellular ROS production. (A) EC-CFU formazan optic density on the 7th day in culture with and without DPI under normoxia (Norm), intermittent hypoxia (IH) and sustained hypoxia (SH) (p < 0.01 for: Norm vs. Norm+DPI, SH vs. SH+DPI; p < 0.1 for IH vs. IH+DPI). (B) Representative photomicrographs of EC-CFUs microscopic fields (X10) of NBT test for Norm, IH and SH with and without 5 μM DPI.
Figure 4
Figure 4
Protein carbonyl formation in EC-CFUs cultures exposed to normoxia, intermittent and sustained hypoxia. Analysis of protein carbonyls levels was based upon 2,4-dinitrophenylhydrazine (DNPH) carbonyl derivation, following immunodetection by using Western Blot (WB) assay with anti-dinitrophenol (DNP) antibodies, followed by densitometric quantitation. (A) Average densitometric quantitation of WB assays of EC-CFUs cultures from 4 different donors exposed to normoxia (Norm), intermittent hypoxia (IH) and sustained hypoxia (SH). (p < 0.017 for: Norm vs. IH) (B) A representative WB analysis of total intracellular protein carbonyls from EC-CFUs cultures in Norm, IH, and SH. (C) The control corresponding Ponceau S total protein stain of the membrane.
Figure 5
Figure 5
The effects of intermittent and sustained hypoxia in vitro on EC-CFUs number and area with and without treatment with apocynin or diphenyl iodide (DPI). (A) Mean EC-CFUs numbers on the 7th day in culture with and without apocynin (100 μM) or diphenyl iodide (DPI) (5 μM) (n = 8). Control cells were exposed for 3 days to intermittent hypoxia (IH) and sustained hypoxia (SH) as specified in Methods and compared to normoxia (Norm). Additional cell cultures were exposed to apocynin or DPI concomitantly with Norm, IH and SH. (p < 0.008 for: Norm vs. IH, IH vs. IH+apocynin). Following DPI treatment no cellular maturation and no EC-CFUs formation was noted. (B) Mean EC-CFU size on the 7th day in culture with and without apocynin (n = 8) was unaffected. No significant differences were found between the areas of EC-CFUs treated with various oxygen treatments or with apocynin. (C) Representative photomicrographs of EC-CFUs microscopic fields (X10) for Norm, IH and SH with and without apocynin or DPI. EC-CFUs colonies are indicated by arrows.
Figure 6
Figure 6
The effects of normoxia, intermittent and sustained hypoxia on the expression of NADPH oxidase gp91-phox subunit in EC-CFUs in the presence of N-acetylcysteine (NAC) and apocynin. Gp91-phox specific fluorescence intensity (FI) was detected using confocal microscopy in EC-CFUs cultured under normoxia (Norm), intermittent hypoxia (IH) and sustained hypoxia (SH). Fixed cells were stained with rabbit anti- gp91-phox primary Abs (diluted 1/150) followed by 1/400 CF 488A anti-rabbit IgG staining (green). Nuclei were stained with DAPI (blue). (A) Average specific FI of gp91-phox subunit expression per colony, with and without 1 mM NAC in (p < 0.008 for: IH vs. Norm, IH vs. IH+NAC and SH vs. SH+NAC). (B) Average FI of specific gp91-phox subunit expression in EC-CFUs per culture well with and without the addition of 1 mM NAC, (p < 0.008 IH vs. Norm, IH vs. IH+NAC). (C) Average FI of gp91-phox subunit specific expression per colony, with and without the addition of 100 μM apocynin, (p < 0.008 IH vs. IH+apocynin). (D) Average FI of specific gp91-phox expression in EC-CFUs per culture well with and without the addition of 100 μM apocynin, (p < 0.008 IH vs. Norm, IH vs. IH+apocynin). (E) Representative photomicrographs of gp91-phox subunit expression in each of the EC-CFUs treated under Norm, IH and SH (X40). In (A–D) determination in three independent experiments.
Figure 7
Figure 7
The effects of normoxia, intermittent and sustained hypoxia on the expression of NADPH oxidase p22phox subunit in EC-CFUs. p22phox specific fluorescence intensity (FI) was detected using confocal microscopy in EC-CFUs cultured under normoxia (Norm), intermittent hypoxia (IH) and sustained hypoxia (SH). Fixed cells were stained with mouse anti-p22phox primary Abs (diluted 1/100) followed by 1/400 CF 647 anti-mouse staining (red). Nuclei were stained with DAPI (blue), in 3 independent experiments. (A) Average FI of p22phox subunit specific expression per colony. (B) Average FI of specific p22phox subunit expression in EC-CFUs per culture well. (C) Representative photomicrographs of p22phox subunit expression in each of the EC-CFUs treated under Norm, IH and SH (X40).
Figure 8
Figure 8
The effects of normoxia, intermittent and sustained hypoxia on Nuclear factor-erythroid 2 related factor 2 (Nrf2) expression in EC-CFUs. Nrf2 specific fluorescence intensity (FI) was detected using confocal microscopy in EC-CFUs cultured under normoxia (Norm), intermittent hypoxia (IH) and sustained hypoxia (SH). Fixed cells were stained with rabbit anti-Nrf2 primary Abs (diluted 1/150) followed by 1/400 CF 488A anti-rabbit IgG staining (green). Nuclei were stained with DAPI (blue). (A) Average FI of Nrf2 specific expression per colony under Norm, IH and SH. (B) Average FI of specific Nrf2 expression in EC-CFUs per well under to Norm, IH and SH. In (A,B), integrated with Image J Software, in 3 independent experiments. (C) Representative photomicrographs of Nrf2 expression in each of the EC-CFUs treated under Norm, IH and SH (X40).
Figure 9
Figure 9
The effects of normoxia, intermittent and sustained hypoxia on cellular proliferation in EC-CFUs. Cellular proliferation was detected by pulse labeling colonies with bromodeoxyuridine (BrdU). Cells were cultured under normoxia (Norm), intermittent hypoxia (IH) and sustained hypoxia (SH) from the re-plating time until day 7 in culture for 6 h every day. (A–C) BrdU labeled cells in the developing EC-CFUs in culture on days 3–7. Each figure represents individual data from a blood donor. (D) Denotes the average values of BrdU labeled cells ± SE in the developing EC-CFUs in culture on days 3–7 for the three subjects. (E) Representative photomicrographs (x40) demonstrating the incorporation of BrdU (dark brown) into proliferating cells within each of the EC-CFUs treated under Norm, IH, and SH (on day 6).
Figure 10
Figure 10
Mean endothelial tube length following treatment with conditioned media harvested from normoxia, intermittent and sustained hypoxia treated EC-CFUs with and without ROS inhibitors. (A) Tube formation by EAhy926 endothelial cells grown for 24 hrs on ECM-Gel with conditioned media harvested from normoxia (Norm), intermittent hypoxia (IH) and sustained hypoxia (SH) treated EC-CFUs (n = 3). Inhibitors used: 1 mM N-acetylcysteine (NAC), 100 μM apocynin and 5 μM diphenyl iodide (DPI). For a positive control, EAhy926 endothelial cells were grown with EGM-2 medium supplemented 20% FCS, and for a negative control, DMEM medium supplemented with 20% FCS was used (p < 0.017 for IH and SH vs. Norm, *p < 0.05, **p < 0.01 compared to Norm in each condition group), as specified in Materials and Methods (B) Representative photomicrographs (X10) of endothelial tube formation with EGM-2 without and with 1 mM NAC, and with DMEM. (C) Representative photomicrographs (X10) of endothelial tube formation with Norm, IH and SH conditioned media using the specified inhibitors.
Figure 11
Figure 11
Whole well images of endothelial tube formation by EAhy926 endothelial cells following treatment with EC-CFUs conditioned media from normoxia, intermittent and sustained hypoxia using various inhibitors. (A) Whole well tube formation by EAhy926 endothelial cells grown for 24 hrs on ECM-Gel with EGM-2 medium without and with NAC, and with DMEM medium (as specified in Figure 10). (B) Whole well tube formation by EAhy926 endothelial cells grown for 24 hrs on ECM-Gel with conditioned media harvested from normoxia (Norm), intermittent hypoxia (IH) and sustained hypoxia (SH) treated EC-CFUs. Inhibitors included 1 mM N-acetylcysteine (NAC), 100 μM apocynin and 5 μM diphenyl iodide (DPI). In (A,B), High-resolution whole-well imaging at x10 magnification with post-acquisition automatic image stitch were performed.
Figure 12
Figure 12
The effects of normoxia, intermittent and sustained hypoxia on VEGF expression in EC-CFUs. VEGF specific fluorescence intensity (FI) was detected using confocal microscopy in EC-CFUs cultured under normoxia (Norm), intermittent hypoxia (IH) and sustained hypoxia (SH). Fixed cells were stained with rabbit anti-VEGF primary Abs (diluted 1/250) followed by 1/400 CF 488A anti-rabbit IgG staining (green). Nuclei were stained with DAPI (blue). (A) Average FI of VEGF specific expression per colony, integrated with Image J Software in 4 independent experiments (p < 0.017 IH vs. Norm, SH vs. Norm). (B) Average FI of specific VEGF expression in EC-CFUs in a whole culture well integrated with Image J Software, in 4 independent experiments (p < 0.017 IH vs. Norm, SH vs. Norm). (C) Representative photomicrographs of VEGF expression in each of the EC-CFUs treated under Norm, IH and SH (X40).

Similar articles

Cited by

References

    1. Lavie L. Obstructive sleep apnoea syndrome–an oxidative stress disorder. Sleep Med Rev. (2003) 7:35–51. 10.1053/smrv.2002.0261 - DOI - PubMed
    1. Marin JM, Carrizo SJ, Vicente E, Agusti AGN. Long-term cardiovascular outcomes in men with obstructive sleep apnoea-hypopnoea with or without treatment with continuous positive airway pressure: an observational study. Lancet (2005) 365:1046–53. 10.1016/S0140-6736(05)71141-7 - DOI - PubMed
    1. Lévy P, Kohler M, McNicholas WT, Barbé F, McEvoy RD, Somers VK, et al. . Obstructive sleep apnoea syndrome. Nat Rev Dis Prim. (2015) 1:15015. 10.1038/nrdp.2015.15 - DOI - PubMed
    1. Lavie L. Oxidative stress in obstructive sleep apnea and intermittent hypoxia–revisited–the bad ugly and good: implications to the heart and brain. Sleep Med Rev. (2015) 20:27–45. 10.1016/j.smrv.2014.07.003 - DOI - PubMed
    1. Dyugovskaya L, Lavie P, Lavie L. Increased adhesion molecules expression and production of reactive oxygen species in leukocytes of sleep apnea patients. Am J Respir Crit Care Med. (2002) 165:934–9. 10.1164/ajrccm.165.7.2104126 - DOI - PubMed

LinkOut - more resources