. 2018 Jun 15:9:1329.
doi: 10.3389/fimmu.2018.01329. eCollection 2018.

In Search for Reliable Markers of Glioma-Induced Polarization of Microglia

Affiliations

In Search for Reliable Markers of Glioma-Induced Polarization of Microglia

Kacper A Walentynowicz et al. Front Immunol. .

Abstract

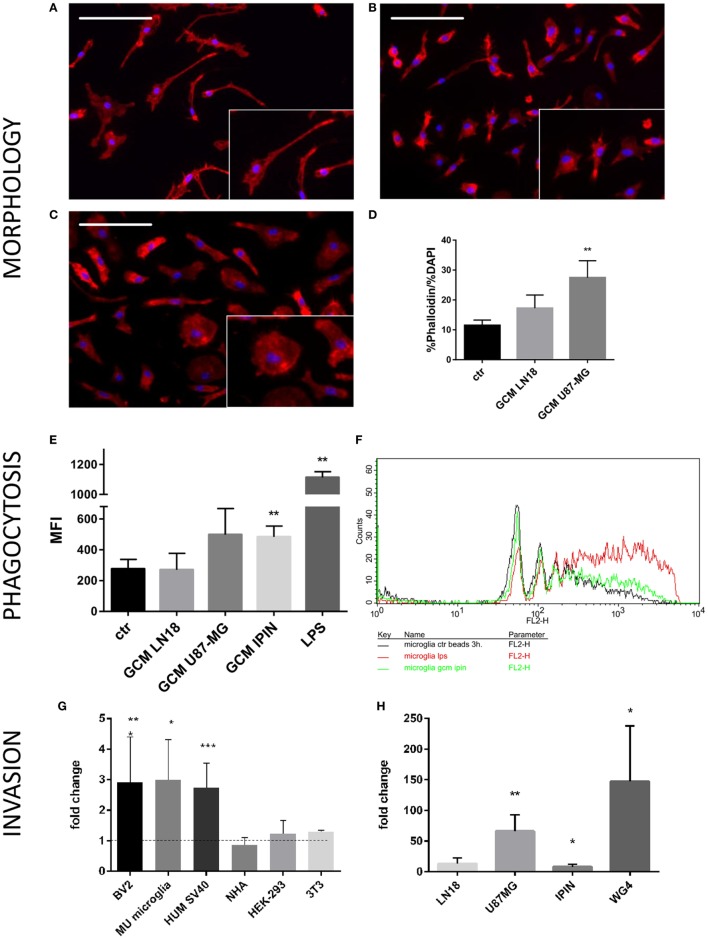
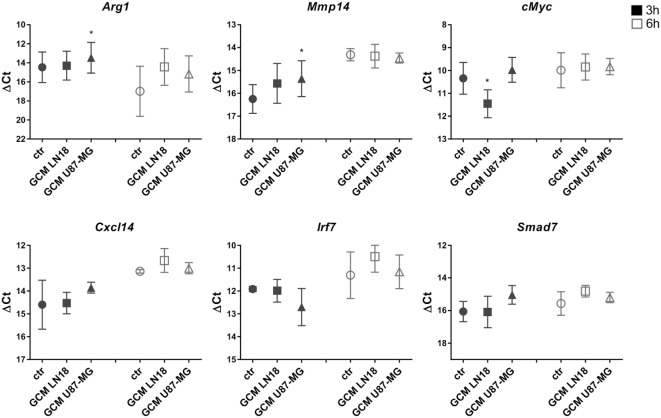
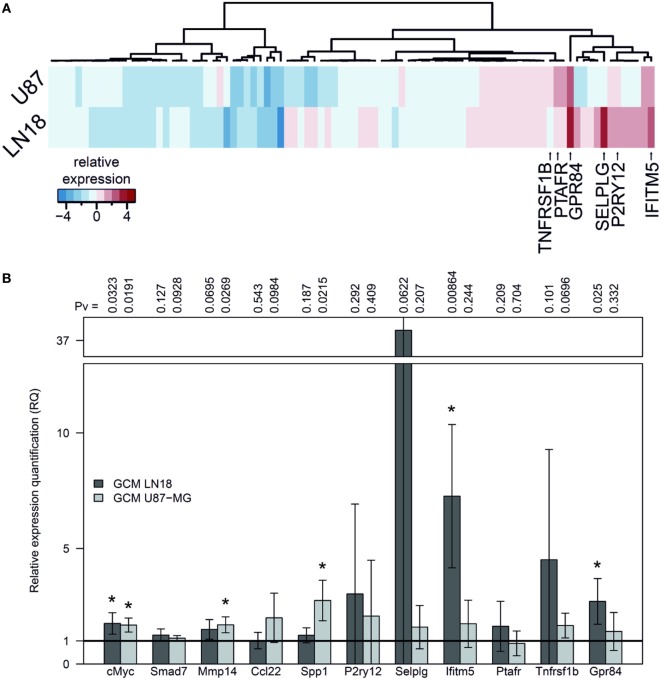
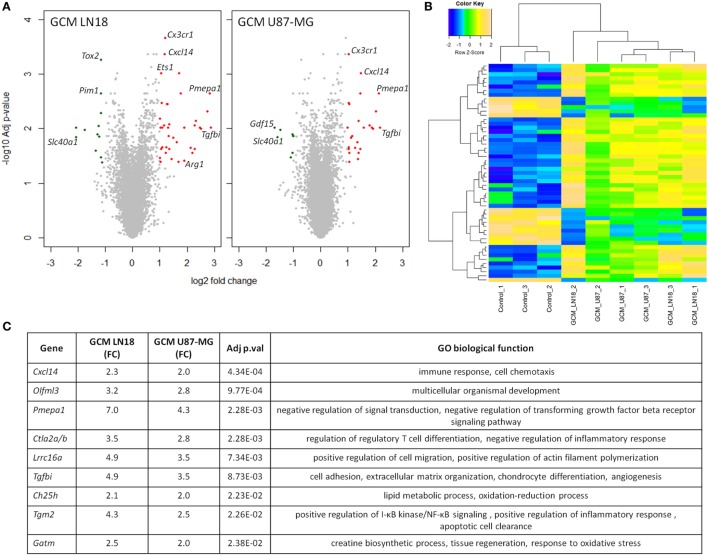
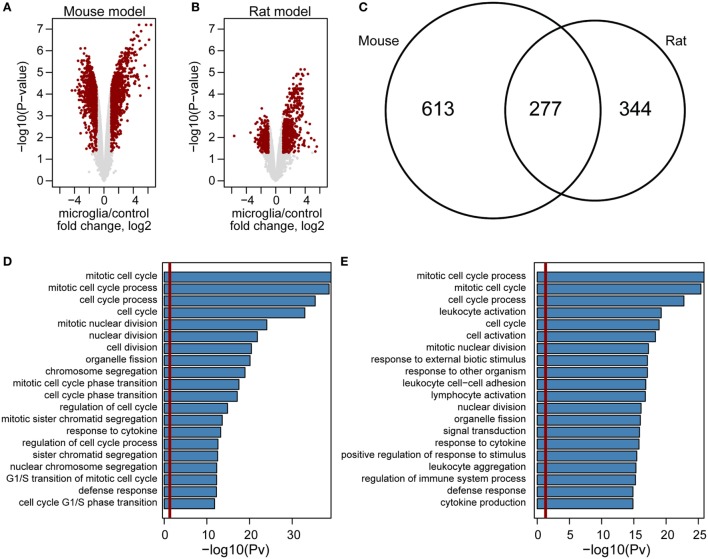
Immune cells accumulating in the microenvironment of malignant tumors are tumor educated and contribute to its growth, progression, and evasion of antitumor immune responses. Glioblastoma (GBM), the common and most malignant primary brain tumor in adults, shows considerable accumulation of resident microglia and peripheral macrophages, and their polarization into tumor-supporting cells. There are controversies regarding a functional phenotype of glioma-associated microglia/macrophages (GAMs) due to a lack of consistent markers. Previous categorization of GAM polarization toward the M2 phenotype has been found inaccurate because of oversimplification of highly complex and heterogeneous responses. In this study, we characterized functional responses and gene expression in mouse and human microglial cultures exposed to fresh conditioned media [glioma-conditioned medium (GCM)] from human U87 and LN18 glioma cells. Functional analyses revealed mutual communication reflected by strong stimulation of glioma invasion by microglial cells and increased microglial phagocytosis after GCM treatment. To define transcriptomic markers of GCM-activated microglia, we performed selected and global gene expression analyses of stimulated microglial cells. We found activated pathways associated with immune evasion and TGF signaling. We performed computational comparison of the expression patterns of GAMs from human GBMs and rodent experimental gliomas to select genes consistently changed in different datasets. The analyses of marker genes in GAMs from different experimental models and clinical samples revealed only a small set of common genes, which reflects variegated responses in clinical and experimental settings. Tgm2 and Gpnmb were the only two genes common in the analyzed data sets. We discuss potential sources of the observed differences and stress a great need for definitive elucidation of a functional state of GAMs.

Keywords: functional phenotype; glioma; glioma-associated microglia/macrophages; microglia; transcriptomics.


Figures

Figure 1
Figure 1
Functional analyses of glioma-induced polarization of murine microglia. Primary murine microglia cultures were co-cultured with human U87-MG or LN18 glioma cells. (A–C) Representative images show morphological changes induced in primary murine microglia cultures following co-culture with human U87-MG or LN18 glioma cells. Morphological alterations were visualized by F-actin staining; cell nuclei were co-stained with DAPI. Insets show in higher magnification numerous microglia with amoeboid shape in co-cultures with U87-MG cells. (D) Changes were quantified by ratio of percentage of Phalloidin staining to percentage of DAPI staining that is proportional to cell size. (E,F) Murine microglia were treated for 24 h with conditioned media [glioma-conditioned medium (GCM)] from human U87-MG, LN18, and IPIN glioma cells or LPS (100 ng/mL), incubated for 3 h with fluorescent beads and subsequently analyzed by flow cytometry. Phagocytosis of fluorescent beads in microglia is represented as mean fluorescence intensity (MFI); graph shows statistically significant groups (F) using one-way ANOVA with Dunnett’s multiple comparisons test; n ≥ 3. (G) Matrigel assay was performed to determine invasion of human U87-MG glioma cells in the presence of different microglial (BV2—immortalized murine microglia, Mu microglia—primary microglial cultures, SV40 immortalized human microglia) or non-microglial cells (NHA—normal human astrocytes, HEP293 cells, and NIH3T3 fibroblasts). Data are calculated as fold change in relation to basal invasion in the absence of microglia. Matrigel invasion data are calculated as means ± SD, n ≥ 3 and were analyzed by one-sided paired sample t-test; n ≥ 3. Differences at p < 0.05 were considered significant (***p < 0.001, **p < 0.01, and *p < 0.05). (H) Invasiveness of various human glioma cells (IPIN and WG4 are primary patient-derived glioma cultures) is increased to different extent in the presence of BV2 murine microglial cells.
Figure 2
Figure 2
The expression of selected genes in glioma-conditioned medium (GCM) stimulated primary murine microglia cultures. Gene expression was determined by qRT-PCR in microglial cultures left untreated (circles), treated with GCM from LN18 (squares), or U87-MG (triangles) for 3 h (black) and 6 h (white). Data are shown as delta Ct values relative to 18S expression. Assessment of statistical significance was performed using one-way ANOVA test, followed by Dunnett’s multiple comparison test. The results are calculated as means ± SD, n ≥ 3. Differences at p < 0.05 were considered as significant (***p < 0.001, **p < 0.01, and *p < 0.05).
Figure 3
Figure 3
Gene expression in human SV40 microglia polarized by factors secreted by human glioma cells. (A) Human Microglial Sensome Gene expression profiling in human SV40 microglia treated by glioma-conditioned medium (GCM) from human LN18 and U87-MG glioma cells was determined with GeneQuery™ Human Microglial Sensome qPCR Array 6 h after GCM addition. The analysis was performed on assorted samples from three replicates for each group (untreated, stimulated with GCM U87-MG or LN18). Heatmap was generated to represent differentially expressed genes and samples. (B) The expression of selected genes (cMYC, SMAD7, MMP14, CCL22, and SPP1) was validated by qPCR in independent cultures of human SV40 microglia treated with GCM from U87-MG or LN18 cells for 6 h. The results are shown as relative quantification (RQ) of GCM stimulated samples compared with untreated controls. Assessment of statistical significance was performed using one-sample t-test. The results are calculated as means ± SD, n ≥ 3. Differences at p < 0.05 were considered as significant (***p < 0.001, **p < 0.01, and *p < 0.05).
Figure 4
Figure 4
Global gene analysis in primary microglia cultures stimulated with glioma-conditioned medium (GCM) from human glioma cells. Primary microglia cultures were treated for 6 h with GCM. Total RNAs were isolated and subjected to Affymetrix microarray analysis. Data were pre-processed as described in Section “Materials and Methods” and significantly regulated genes are depicted. (A) Volcano plots represent log2 fold change versus −log10 adjusted p-value in microglia treated with GCM from LN18 and U87-MG glioma cells; upregulated genes are marked in red; downregulated genes in green. (B) Heatmap was generated to show significantly differentially expressed genes and sample clustering. (C) Selected top significantly upregulated genes in microglia treated with GCM LN18 or U87-MG were listed in a table with fold change expression (FC), adjusted p-value, and associated Gene Ontology (GO) biological functions. Significance was assigned to adj p-val < 0.05.
Figure 5
Figure 5
Genome-wide comparison of gene expression in microglia in mouse and rat glioma models. Volcano plot of gene expression changes in glioma-associated microglia/macrophages from mouse (A) and rat (B) models. The data for all genes are plotted as log2 fold change between microglia and control samples versus the −log10 of the corresponding adjusted p-values. Genes selected as significantly different are highlighted as red dots. Venn diagram for overlap of genes upregulated in mouse (left) and rat (right) model (C). Enrichment analysis of Gene Ontology terms within mouse (D) and rat (E) upregulated genes. Bar plots represent the statistical significance of the enrichment [−log10 (p-val)] (D,E).

References

    1. Komohara Y, Ohnishi K, Kuratsu J, Takeya M. Possible involvement of the M2 anti-inflammatory macrophage phenotype in growth of human gliomas. J Pathol (2008) 216:15–24.10.1002/path.2370 - DOI - PubMed
    1. Gabrusiewicz K, Rodriguez B, Wei J, Hashimoto Y, Healy LM, Maiti SN, et al. Glioblastoma-infiltrated innate immune cells resemble M0 macrophage phenotype. JCI Insight (2016) 1:1–32.10.1172/jci.insight.85841 - DOI - PMC - PubMed
    1. Szulzewsky F, Arora S, de Witte L, Ulas T, Markovic D, Schultze JL, et al. Human glioblastoma-associated microglia/monocytes express a distinct RNA profile compared to human control and murine samples. Glia (2016) 64:1416–36.10.1002/glia.23014 - DOI - PubMed
    1. Badie B, Schartner JM. Flow cytometric characterization of tumor-associated macrophages in experimental gliomas. Neurosurgery (2000) 46:957–62.10.1227/00006123-200004000-00035 - DOI - PubMed
    1. Szulzewsky F, Pelz A, Feng X, Synowitz M, Markovic D, Langmann T, et al. Glioma-associated microglia/macrophages display an expression profile different from M1 and M2 polarization and highly express Gpnmb and Spp1. PLoS One (2015) 10(2):e0116644.10.1371/journal.pone.0116644 - DOI - PMC - PubMed