

Systems pathology analysis identifies neurodegenerative nature of age-related vitreoretinal interface diseases
- PMID: 29963742
- PMCID: PMC6156470
- DOI: 10.1111/acel.12809
Systems pathology analysis identifies neurodegenerative nature of age-related vitreoretinal interface diseases
Abstract
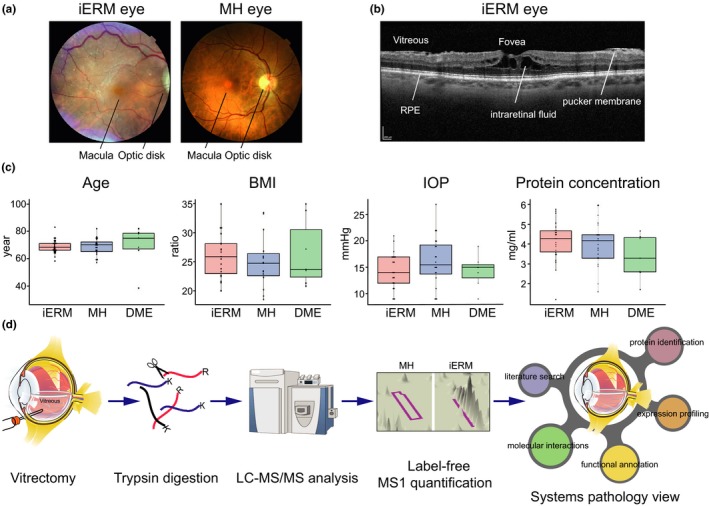
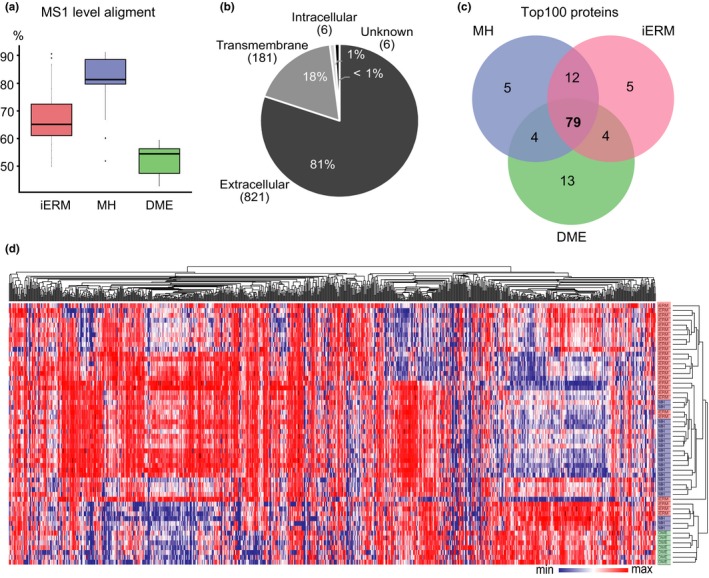
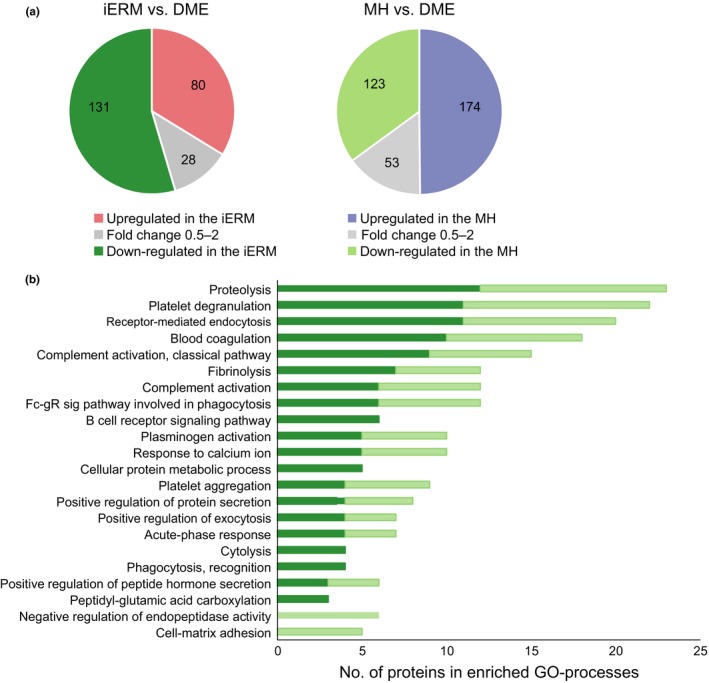
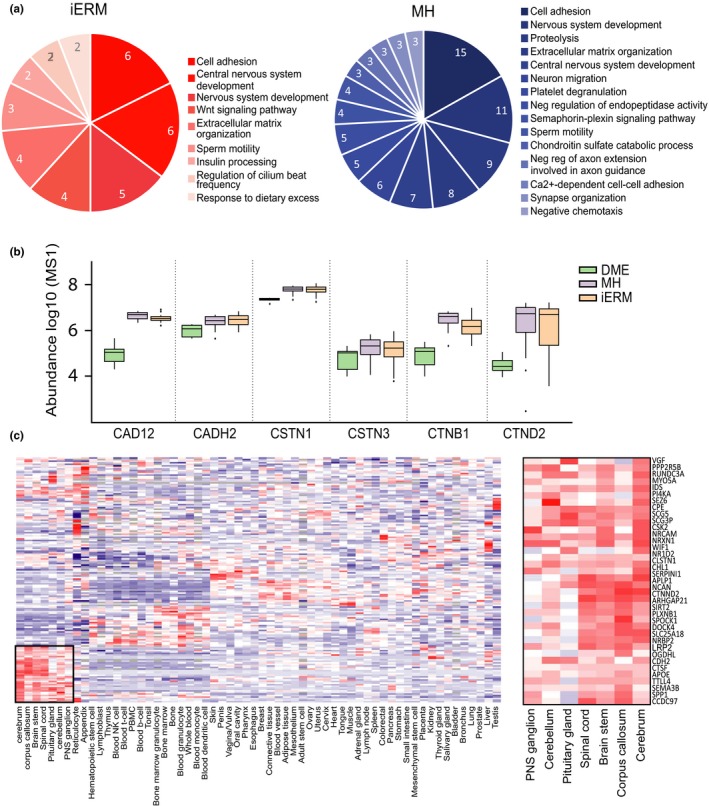
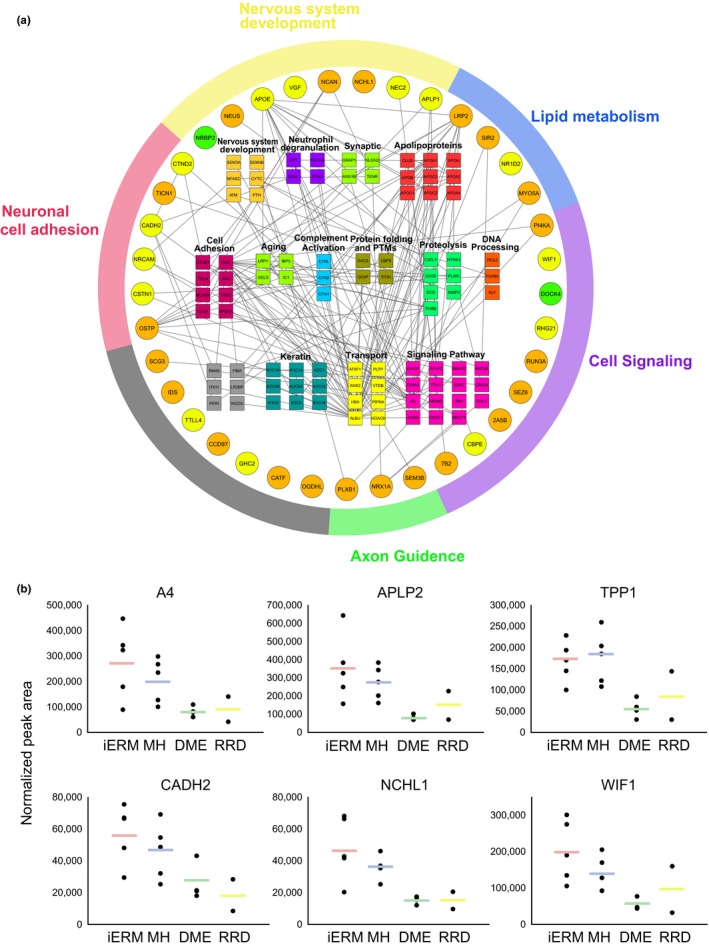
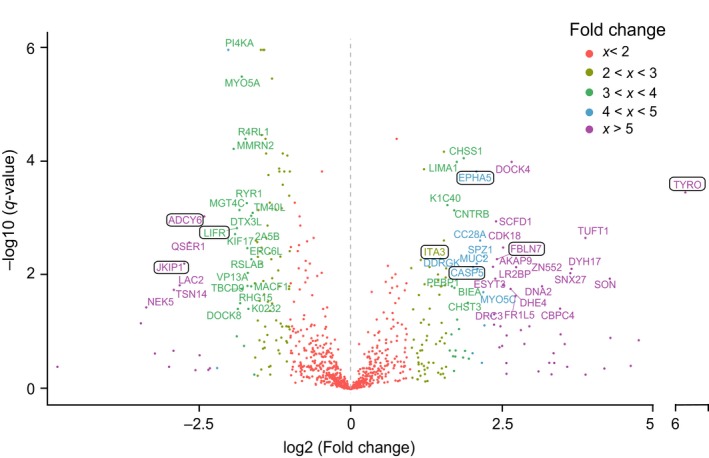
Aging is a phenomenon that is associated with profound medical implications. Idiopathic epiretinal membrane (iEMR) and macular hole (MH) are the major vision-threatening vitreoretinal diseases affecting millions of aging people globally, making these conditions an important public health issue. iERM is characterized by fibrous tissue developing on the surface of the macula, which leads to biomechanical and biochemical macular damage. MH is a small breakage in the macula and is associated with many ocular conditions. Although several individual factors and pathways are suggested, a systems pathology level understanding of the molecular mechanisms underlying these disorders is lacking. Therefore, we performed mass spectrometry-based label-free quantitative proteomics analysis of the vitreous proteomes from patients with iERM and MH to identify the key proteins, as well as the multiple interconnected biochemical pathways, contributing to the development of these diseases. We identified a total of 1,014 unique proteins, many of which are linked to inflammation and the complement cascade, revealing the inflammation processes in retinal diseases. Additionally, we detected a profound difference in the proteomes of iEMR and MH compared to those of diabetic retinopathy with macular edema and rhegmatogenous retinal detachment. A large number of neuronal proteins were present at higher levels in the iERM and MH vitreous, including neuronal adhesion molecules, nervous system development proteins, and signaling molecules, pointing toward the important role of neurodegenerative component in the pathogenesis of age-related vitreoretinal diseases. Despite them having marked similarities, several unique vitreous proteins were identified in both iERM and MH, from which candidate targets for new diagnostic and therapeutic approaches can be provided.
Keywords: MS-based quantitative proteomics; aging; epiretinal membrane; macular hole; neurodegeneration; vitreous humor.
© 2018 The Authors. Aging Cell published by the Anatomical Society and John Wiley & Sons Ltd.
Figures
Similar articles
-
The Expression of GDF-15 in the Human Vitreous in the Presence of Retinal Pathologies with an Inflammatory Component.Ocul Immunol Inflamm. 2016;24(2):178-83. doi: 10.3109/09273948.2014.981549. Epub 2015 Jul 15. Ocul Immunol Inflamm. 2016. PMID: 26177355
-
[Pathology of the vitreomacular interface].Oftalmologia. 2014;58(2):3-7. Oftalmologia. 2014. PMID: 25300121 Romanian.
-
Involvement of premacular mast cells in the pathogenesis of macular diseases.PLoS One. 2019 Feb 22;14(2):e0211438. doi: 10.1371/journal.pone.0211438. eCollection 2019. PLoS One. 2019. PMID: 30794552 Free PMC article.
-
Vitrectomy for Epiretinal Membranes and Macular Holes in Uveitis Patients.J Ocul Pharmacol Ther. 2017 May;33(4):298-303. doi: 10.1089/jop.2016.0142. Epub 2017 Jan 23. J Ocul Pharmacol Ther. 2017. PMID: 28112568 Review.
-
Idiopathic epiretinal membrane.Retina. 2014 Dec;34(12):2317-35. doi: 10.1097/IAE.0000000000000349. Retina. 2014. PMID: 25360790 Review.
Cited by
-
Diabetic retinopathy: Involved cells, biomarkers, and treatments.Front Pharmacol. 2022 Aug 9;13:953691. doi: 10.3389/fphar.2022.953691. eCollection 2022. Front Pharmacol. 2022. PMID: 36016568 Free PMC article. Review.
-
The potential of serum elabela levels as a marker of diabetic retinopathy: results from a pilot cross-sectional study.PeerJ. 2025 Jan 8;13:e18841. doi: 10.7717/peerj.18841. eCollection 2025. PeerJ. 2025. PMID: 39802191 Free PMC article.
-
Proteomic Biomarkers of Retinal Inflammation in Diabetic Retinopathy.Int J Mol Sci. 2019 Sep 25;20(19):4755. doi: 10.3390/ijms20194755. Int J Mol Sci. 2019. PMID: 31557880 Free PMC article. Review.
-
Systemic oxidative stress biomarkers in patients with vitreomacular traction syndrome.Int Ophthalmol. 2021 Nov;41(11):3789-3796. doi: 10.1007/s10792-021-01949-0. Epub 2021 Jul 14. Int Ophthalmol. 2021. PMID: 34259960
-
Proteomics profiling of vitreous humor reveals complement and coagulation components, adhesion factors, and neurodegeneration markers as discriminatory biomarkers of vitreoretinal eye diseases.Front Immunol. 2023 Feb 16;14:1107295. doi: 10.3389/fimmu.2023.1107295. eCollection 2023. Front Immunol. 2023. PMID: 36875133 Free PMC article.
References
-
- Bian, Z. M. , Elner, S. G. , Khanna, H. , Murga‐Zamalloa, C. A. , Patil, S. , & Elner, V. M. (2011). Expression and functional roles of caspase‐5 in inflammatory responses of human retinal pigment epithelial cells. Investigative Ophthalmology & Visual Science, 52(12), 8646–8656. 10.1167/iovs.11-7570 - DOI - PMC - PubMed
MeSH terms
Substances
Grants and funding
LinkOut - more resources
Full Text Sources
Other Literature Sources
Medical
