

Fluorinated Gold Nanoparticles for Nanostructure Imaging Mass Spectrometry
- PMID: 29966083
- PMCID: PMC10283077
- DOI: 10.1021/acsnano.8b02376
Fluorinated Gold Nanoparticles for Nanostructure Imaging Mass Spectrometry
Abstract
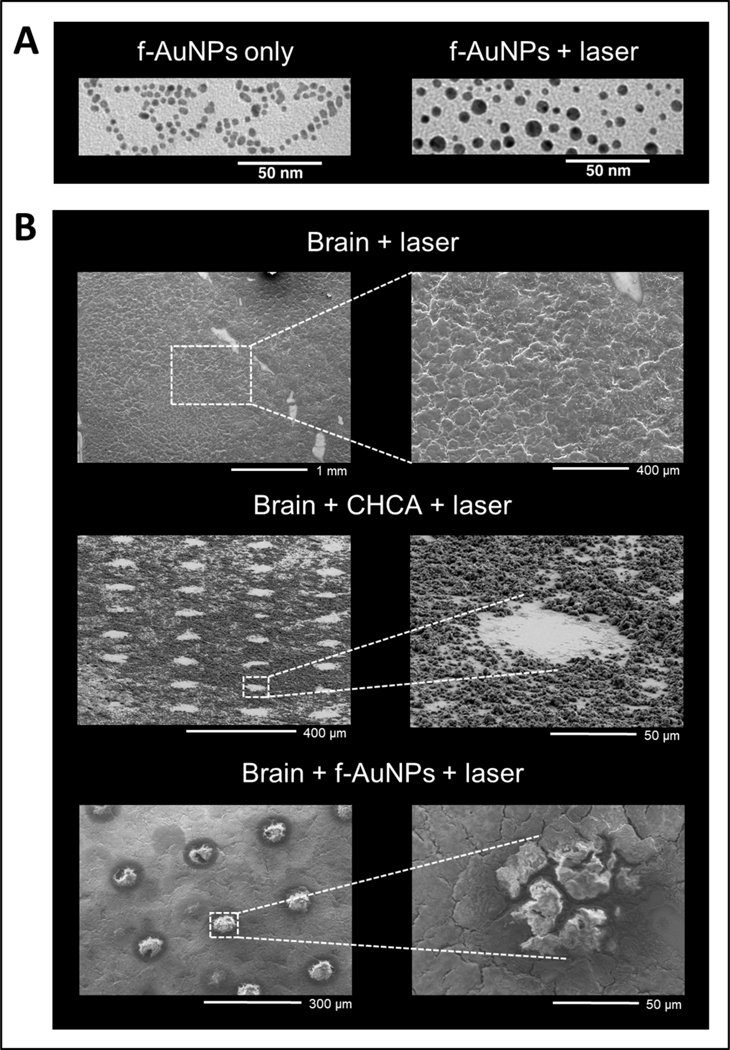
Nanostructure imaging mass spectrometry (NIMS) with fluorinated gold nanoparticles (f-AuNPs) is a nanoparticle assisted laser desorption/ionization approach that requires low laser energy and has demonstrated high sensitivity. Here we describe NIMS with f-AuNPs for the comprehensive analysis of metabolites in biological tissues. F-AuNPs assist in desorption/ionization by laser-induced release of the fluorocarbon chains with minimal background noise. Since the energy barrier required to release the fluorocarbons from the AuNPs is minimal, the energy of the laser is maintained in the low μJ/pulse range, thus limiting metabolite in-source fragmentation. Electron microscopy analysis of tissue samples after f-AuNP NIMS shows a distinct "raising" of the surface as compared to matrix assisted laser desorption ionization ablation, indicative of a gentle desorption mechanism aiding in the generation of intact molecular ions. Moreover, the use of perfluorohexane to distribute the f-AuNPs on the tissue creates a hydrophobic environment minimizing metabolite solubilization and spatial dislocation. The transfer of the energy from the incident laser to the analytes through the release of the fluorocarbon chains similarly enhances the desorption/ionization of metabolites of different chemical nature, resulting in heterogeneous metabolome coverage. We performed the approach in a comparative study of the colon of mice exposed to three different diets. F-AuNP NIMS allows the direct detection of carbohydrates, lipids, bile acids, sulfur metabolites, amino acids, nucleotide precursors as well as other small molecules of varied biological origins. Ultimately, the diversified molecular coverage obtained provides a broad picture of a tissue's metabolic organization.
Keywords: fiber free diet; gut microbiome; mass spectrometry imaging; metabolomics; mice; nanostructure imaging mass spectrometry; perfluorinated gold nanoparticles.
Conflict of interest statement
Figures


Similar articles
-
Mass Spectrometry Imaging of Metabolites by Nanostructure Initiator Mass Spectrometry with Fluorinated Gold Nanoparticles.Methods Mol Biol. 2022;2437:117-125. doi: 10.1007/978-1-0716-2030-4_8. Methods Mol Biol. 2022. PMID: 34902144
-
Comprehensive bioimaging with fluorinated nanoparticles using breathable liquids.Nat Commun. 2015 Jan 20;6:5998. doi: 10.1038/ncomms6998. Nat Commun. 2015. PMID: 25601659 Free PMC article.
-
Charting Metabolism Heterogeneity by Nanostructure Imaging Mass Spectrometry: From Biological Systems to Subcellular Functions.J Am Soc Mass Spectrom. 2020 Dec 2;31(12):2392-2400. doi: 10.1021/jasms.0c00204. Epub 2020 Aug 10. J Am Soc Mass Spectrom. 2020. PMID: 33595331
-
Nanostructure imaging mass spectrometry: the role of fluorocarbons in metabolite analysis and yoctomole level sensitivity.Methods Mol Biol. 2015;1203:141-9. doi: 10.1007/978-1-4939-1357-2_14. Methods Mol Biol. 2015. PMID: 25361674 Free PMC article. Review.
-
Surface analysis of lipids by mass spectrometry: more than just imaging.Prog Lipid Res. 2013 Oct;52(4):329-53. doi: 10.1016/j.plipres.2013.04.005. Epub 2013 Apr 24. Prog Lipid Res. 2013. PMID: 23623802 Review.
Cited by
-
Metabolic Molecular Diagnosis of Inflammatory Bowel Disease by Synergistical Promotion of Layered Titania Nanosheets with Graphitized Carbon.Phenomics. 2022 Jun 1;2(4):261-271. doi: 10.1007/s43657-022-00055-0. eCollection 2022 Aug. Phenomics. 2022. PMID: 36939785 Free PMC article.
-
Influence of core size and capping ligand of gold nanoparticles on the desorption/ionization efficiency of small biomolecules in AP-SALDI-MS.Anal Sci Adv. 2020 Apr 23;1(4):210-220. doi: 10.1002/ansa.202000002. eCollection 2020 Dec. Anal Sci Adv. 2020. PMID: 38716387 Free PMC article.
-
Surface-assisted laser desorption/ionization mass spectrometry imaging: A review.Mass Spectrom Rev. 2022 May;41(3):373-420. doi: 10.1002/mas.21670. Epub 2020 Nov 10. Mass Spectrom Rev. 2022. PMID: 33174287 Free PMC article. Review.
-
Plasmonic Alloys Enhanced Metabolic Fingerprints for the Diagnosis of COPD and Exacerbations.ACS Cent Sci. 2024 Jan 27;10(2):331-343. doi: 10.1021/acscentsci.3c01201. eCollection 2024 Feb 28. ACS Cent Sci. 2024. PMID: 38435520 Free PMC article.
-
Construction of a ternary component chip with enhanced desorption efficiency for laser desorption/ionization mass spectrometry based metabolic fingerprinting.Front Bioeng Biotechnol. 2023 Jan 20;11:1118911. doi: 10.3389/fbioe.2023.1118911. eCollection 2023. Front Bioeng Biotechnol. 2023. PMID: 36741764 Free PMC article.
References
-
- Kompauer M; Heiles S; Spengler B. Atmospheric Pressure MALDI Mass Spectrometry Imaging of Tissues and Cells at 1.4-Mum Lateral Resolution. Nat. Methods 2017, 14, 90–96. - PubMed
-
- Ly A; Buck A; Balluff B; Sun N; Gorzolka K; Feuchtinger A; Janssen KP; Kuppen PJK; Van De Velde CJH; Weirich G; Erlmeier F; Langer R; Aubele M; Zitzelsberger H; McDonnell L; Aichler M; Walch A. High-Mass-Resolution MALDI Mass Spectrometry Imaging of Metabolites from Formalin-Fixed Paraffin-Embedded Tissue. Nat. Protoc 2016, 11, 1428–1443. - PubMed
-
- Sturtevant D; Lee YJ; Chapman KD Matrix Assisted Laser Desorption/IonizationMass Spectrometry Imaging (MALDI-MSI) for Direct Visualization of Plant Metabolites in Situ. Current Opinion in Biotechnology 2016, 53–60. - PubMed
-
- Vickerman JC Molecular Imaging and Depth Profiling by Mass Spectrometry—SIMS, MALDI or DESI? Analyst 2011, 136, 2199–2217. - PubMed
Publication types
MeSH terms
Substances
Grants and funding
LinkOut - more resources
Full Text Sources
Other Literature Sources
