Review
. 2018 Jun 29;7(7):68.
doi: 10.3390/cells7070068.

Metabolic Stress in the Immune Function of T Cells, Macrophages and Dendritic Cells

Affiliations
Review

Metabolic Stress in the Immune Function of T Cells, Macrophages and Dendritic Cells

Charlotte Domblides et al. Cells. .

Abstract

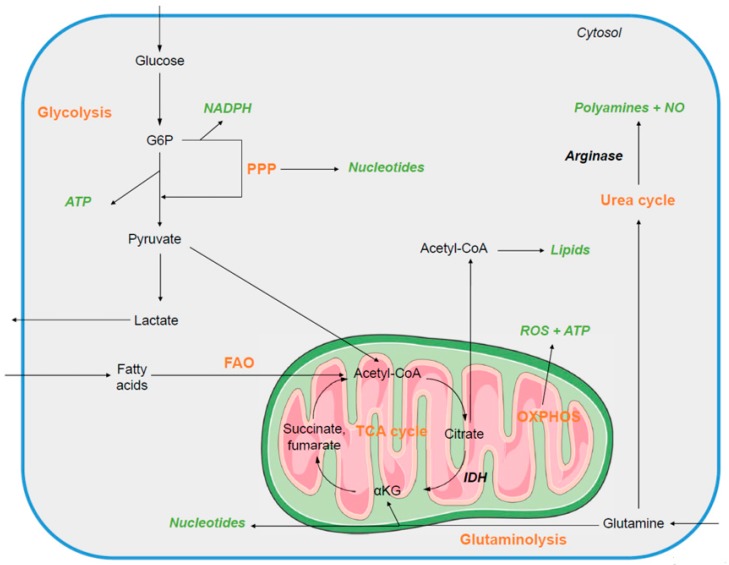
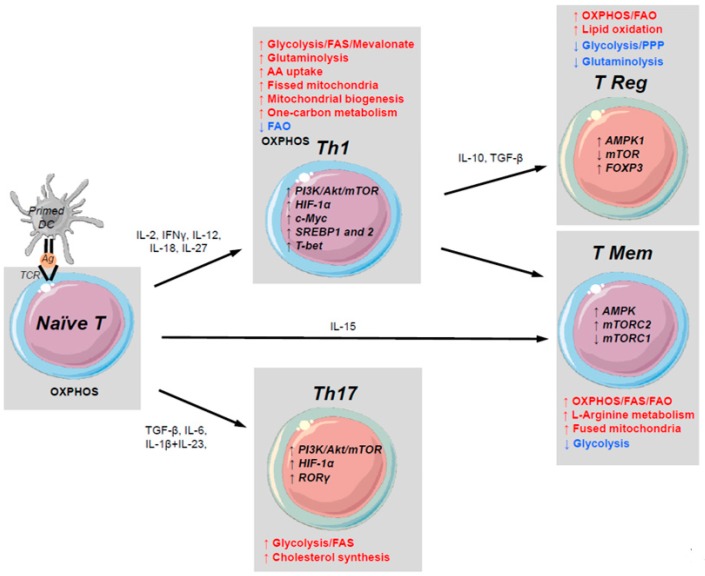
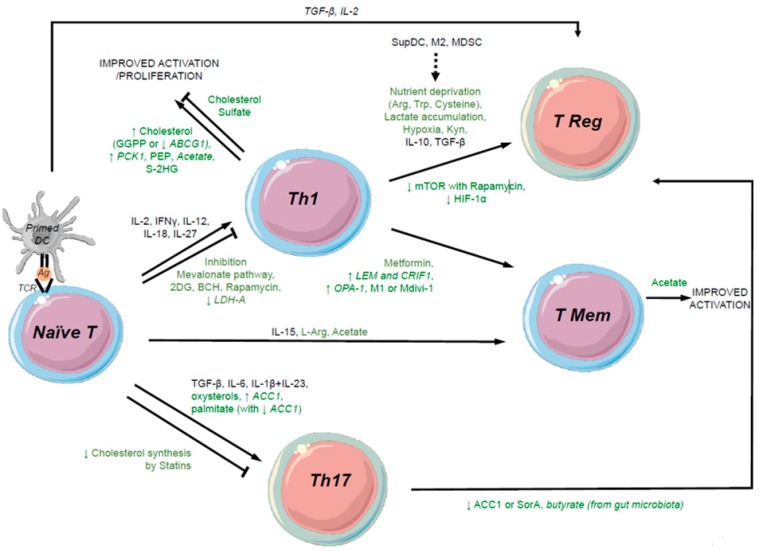
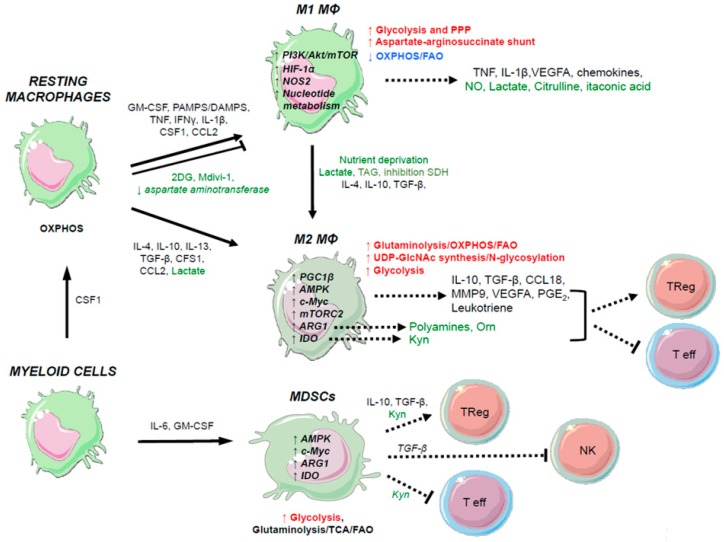
Innate and adaptive immune cells from myeloid and lymphoid lineages resolve host infection or cell stress by mounting an appropriate and durable immune response. Upon sensing of cellular insults, immune cells become activated and undergo rapid and efficient functional changes to unleash biosynthesis of macromolecules, proliferation, survival, and trafficking; unprecedented events among other mammalian cells within the host. These changes must become operational within restricted timing to rapidly control the insult and to avoid tissue damage and pathogen spread. Such changes occur at high energy cost. Recent advances have established that plasticity of immune functions occurs in distinct metabolic stress features. Evidence has accumulated to indicate that specific metabolic signatures dictate appropriate immune functions in both innate and adaptive immunity. Importantly, recent studies have shed light on whether successfully manipulating particular metabolic targets is sufficient to modulate immune function and polarization, thereby offering strong therapeutic potential for various common immune-mediated diseases, including inflammation and autoimmune-associated diseases and cancer. In this review, we detail how cellular metabolism controls immune function and phenotype within T cells and macrophages particularly, and the distinct molecular metabolic programming and targets instrumental to engage this regulation.

Keywords: Immunology; adaptive immunity; innate immunity; metabolic stress; metabolism.


Conflict of interest statement

The authors declare no conflict of interest.

Figures

Figure 1
Figure 1
The primary metabolic pathways in quiescent immune cells. The main catabolic pathways (orange) that contribute to the production of macromolecules or metabolites (green) in quiescent mammalian immune cells are the mitochondrial tricarboxylic acid (TCA) cycle and oxidative phosphorylation (OXPHOS) for ATP synthesis, fatty-acid oxidation (FAO), glutaminolysis, and urea cycle.
Figure 2
Figure 2
Metabolic rewiring following T cell activation. Metabolic requirements are indicated for the differentiation of quiescent naive T cells into Th1, Th17, TRegs, or T memory immune phenotypes. The primary metabolic pathways for each immune phenotype that are upregulated, downregulated, or unchanged are indicated in red, blue, or black respectively. The primary metabolic markers involved in these pathways within immune cells are indicated in bold black (metabolic enzymes or transcription factors). Soluble immune markers that regulate these T cell phenotypes are indicated in black (cytokines, growth factors). PI3K, phosphoinositide 3-kinase; Akt, protein kinase B; mTOR, mammalian target of rapamycin; HIF-1α, hypoxia-inducible factor 1-alpha; AMPK, AMP-activated protein kinase; SREBP, sterol regulatory element-binding protein; T-bet, T-box expressed in T cells; FAS, fatty-acid synthesis; AA, amino acids; FAO, fatty-acid oxidation; RORγ, RAR-related orphan receptor gamma; FOXP3, forkhead box P3; PPP, pentose phosphate pathway; TCR, T cell receptor; Ag, antigen.
Figure 3
Figure 3
Regulation of metabolic rewiring upon T cell activation. Soluble immune markers that regulate the phenotype of naive T cells, Th1, Th17, TRegs, or T cell memory are indicated in black (cytokines, growth factors), and those related to cell metabolism (macromolecules, metabolites, pharmacological agents) are indicated in green. Green arrows indicate the modulation of metabolic gene expression through overexpression or gene silencing. As described in this figure, the use of various metabolites or the modulation of metabolic gene expression within T cells summarized here (in green) can lead to skew the phenotype and polarization of immune cells, and thereby modulating their immune functions. For example, the treatment of Naïve T cells with the metabolite 2DG or the down-regulation of LDH-A gene expression in these cells can impair their activation and polarization into Th1 phenotype. In addition, the treatment of Th1 cells with metformin or the upregulation of LEM gene expression can improve differenciation into memory T cells. 2DG, 2-deoxy-D-glucose; mTOR, mammalian target of rapamycin; GGPP, geranylgeranyl diphosphate; ABCG1, ATP binding cassette subfamily G member 1; PCK1, phosphoenolpyruvate carboxykinase 1; PEP, phosphoenolpyruvate; S-2HG, S-2-hydroxyglutarate; LDH-A, lactate dehydrogenase A; ACC1, acetyl-CoA carboxylase 1; L-Arg, l-arginine; Trp, tryptophane; CRIF1, CR6-interacting factor 1; OPA-1, optic atrophy protein 1; SorA, soraphen polyketide synthase A; Kyn, Kynurenine; TCR, T cell receptor; Ag, antigen.
Figure 4
Figure 4
Metabolic rewiring following activation of macrophages. Metabolic requirements are indicated for the differentiation of resting macrophages into M1, M2, or MDSCs. The primary metabolic pathways for each immune phenotype that are upregulated (red), downregulated (blue), or unchanged (black) are indicated. The primary metabolic markers involved in these pathways are indicated in bold black (metabolic enzymes or transcription factors) within immune cells depicted. Soluble immune markers that regulate these differentiation states are indicated in black (cytokines, growth factors, pathogens, danger signals), and those related to cell metabolism (macromolecules, metabolites, pharmacological agents) are indicated in green. Green arrows indicate the modulation of metabolic gene expression through overexpression or gene silencing. As described in this figure, the use of various metabolites or the modulation of metabolic gene expression within macrophages summarized here (in green) can lead to skew the phenotype and polarization of immune cells, and thereby modulating their immune functions. For example, the treatment of resting macrophages by the metabolite 2DG or the down-regulation of aspartate aminotransferase gene expression, can impair their activation into M1 macrophages. 2DG, 2-deoxy-d-glucose; PI3K, phosphoinositide 3-kinase; Akt, protein kinase B; mTOR, mammalian target of rapamycin; HIF-1α, hypoxia-inducible factor 1-alpha; NOS2, nitric oxide synthase 2; AMPK, AMP-activated protein kinase; ARG1, arginase 1; IDO1, indoleamine 2,3-dioxygenase 1; Orn, ornithine; Kyn, kynurenine; TCA, tricarboxylic acid cycle.
Figure 5
Figure 5
Metabolic rewiring following activation of dendritic cells. Metabolic requirements are indicated for the differentiation of resting dendritic cells (DCs) into plasmacytoid DCs, primed DCs, or suppressive DCs. The primary metabolic pathways for each immune phenotype that are upregulated (red), downregulated (blue), or unchanged (black) are indicated. The primary metabolic markers involved in these pathways are indicated in bold black (metabolic enzymes or transcription factors) within immune cells depicted. Soluble immune markers that regulate these differentiation states are indicated in black (cytokines, growth factors, pathogens, danger signals), and those related to cell metabolism (macromolecules, metabolites, pharmacological agents) are indicated in green. Green arrows indicate the modulation of metabolic gene expression through overexpression or gene silencing. As described in this figure, the use of various metabolites or the modulation of metabolic gene expression within DCs summarized here (in green) can lead to skew the phenotype and polarization of immune cells, and thereby modulating their immune functions. 2DG, 2-deoxy-d-glucose; HIF-1α, hypoxia-inducible factor 1-alpha; NOS2, nitric oxide synthase 2; AMPK, AMP-activated protein kinase; ARG1, arginase 1; IDO1, indoleamine 2,3-dioxygenase 1; Orn, ornithine; Kyn, kynurenine; TCA, tricarboxylic acid cycle; NO, nitric oxide; TLRs, toll-like receptors; IFNs, interferons; PPARα, peroxisome proliferator-activated receptor alpha.

References

    1. Macintyre A.N., Rathmell J.C. Activated lymphocytes as a metabolic model for carcinogenesis. Cancer Metab. 2015;1:5. doi: 10.1186/2049-3002-1-5. - DOI - PMC - PubMed
    1. Anderson N.M., Mucka P., Kern J.G., Feng H. The emerging role and targetability of the TCA cycle in cancer metabolism. Protein Cell. 2017;9:216–237. doi: 10.1007/s13238-017-0451-1. - DOI - PMC - PubMed
    1. Warburg O. On the origin of cancer cells. Science. 1956;123:309–314. doi: 10.1126/science.123.3191.309. - DOI - PubMed
    1. Lunt S.Y., Vander Heiden M.G. Aerobic glycolysis: Meeting the metabolic requirements of cell proliferation. Annu. Rev. Cell Dev. Biol. 2011;27:441–464. doi: 10.1146/annurev-cellbio-092910-154237. - DOI - PubMed
    1. Morin A., Letouzé E., Gimenez-Roqueplo A.-P., Favier J. Oncometabolites-driven tumorigenesis: From genetics to targeted therapy. Int. J. Cancer. 2014;135:2237–2248. doi: 10.1002/ijc.29080. - DOI - PubMed

LinkOut - more resources