. 2018 Sep 1;441(1):132-145.
doi: 10.1016/j.ydbio.2018.06.020. Epub 2018 Jul 11.

Hedgehog signaling from the Posterior Signaling Center maintains U-shaped expression and a prohemocyte population in Drosophila

Affiliations

Hedgehog signaling from the Posterior Signaling Center maintains U-shaped expression and a prohemocyte population in Drosophila

Rajkumar Baldeosingh et al. Dev Biol. .

Abstract

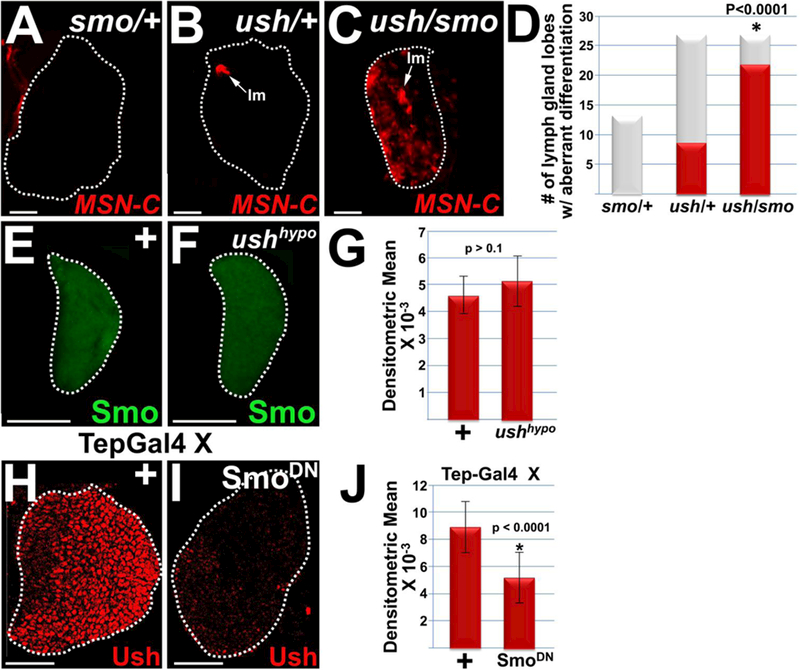
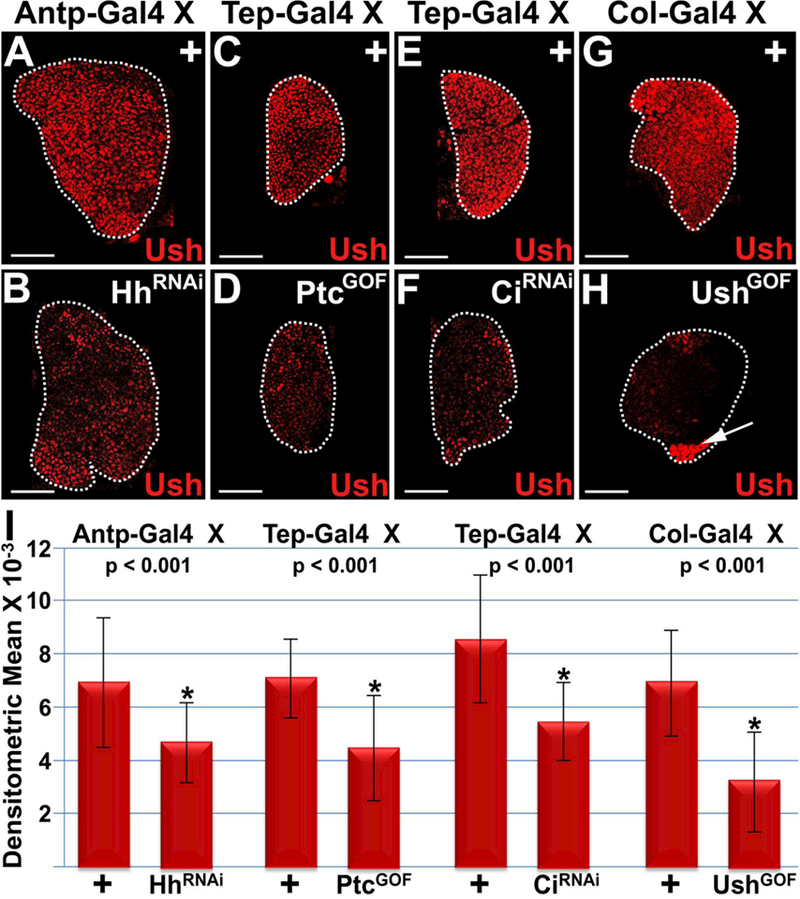
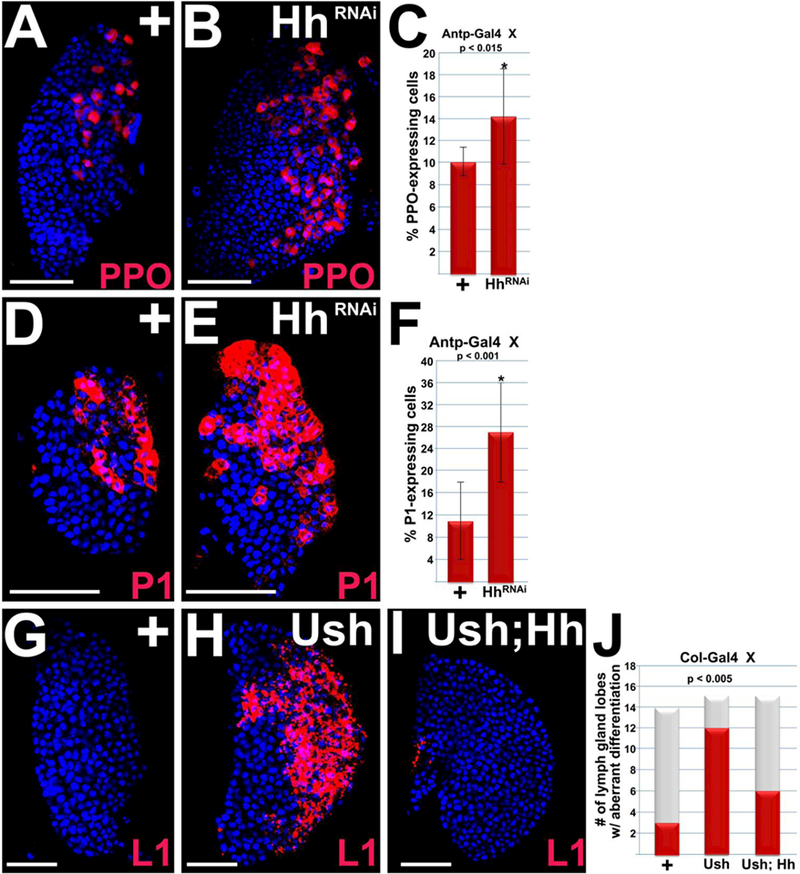
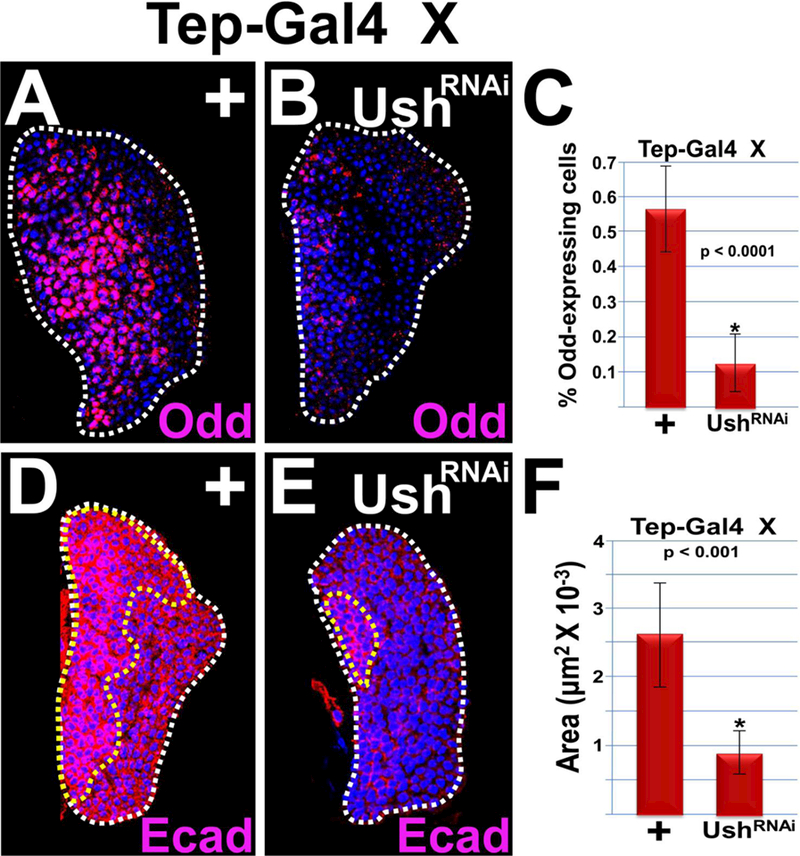
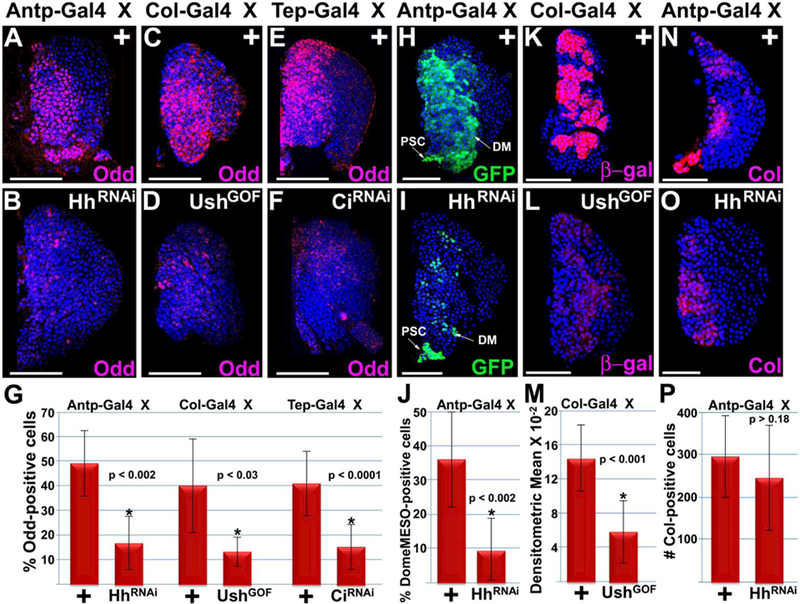
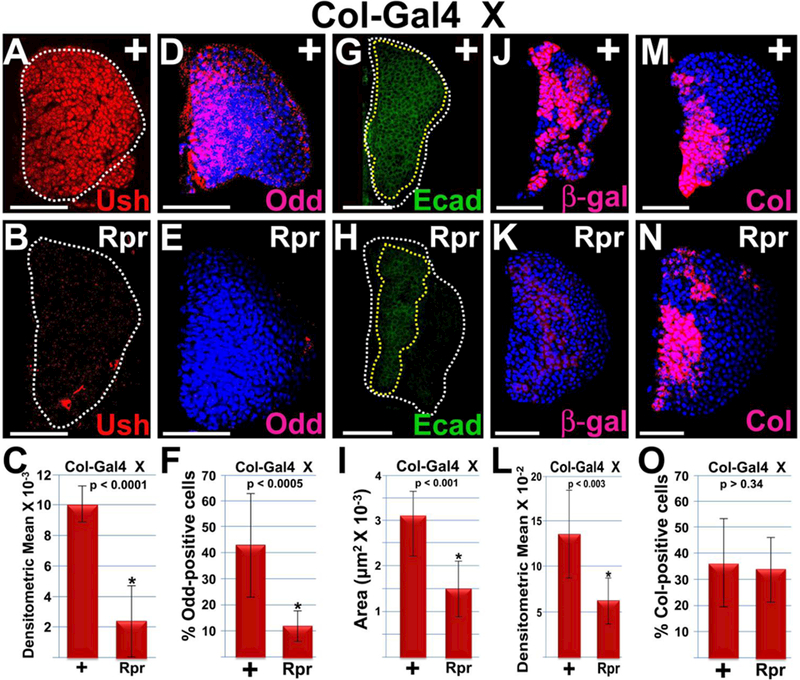
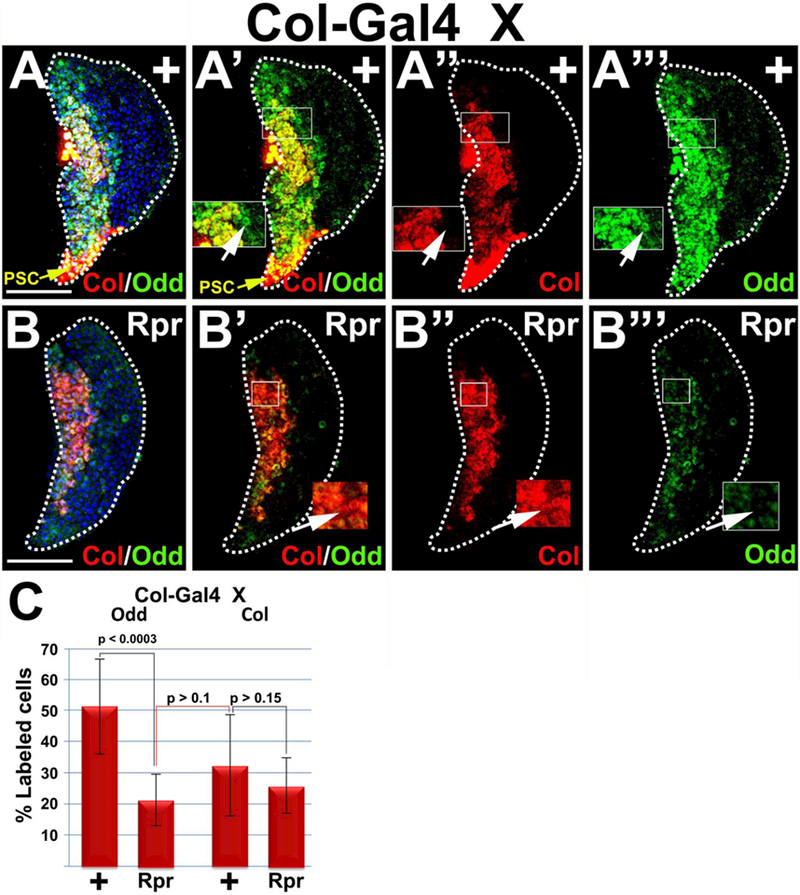
Hematopoietic progenitor choice between multipotency and differentiation is tightly regulated by intrinsic factors and extrinsic signals from the surrounding microenvironment. The Drosophila melanogaster hematopoietic lymph gland has emerged as a powerful tool to investigate mechanisms that regulate hematopoietic progenitor choice in vivo. The lymph gland contains progenitor cells, which share key characteristics with mammalian hematopoietic progenitors such as quiescence, multipotency and niche-dependence. The lymph gland is zonally arranged, with progenitors located in medullary zone, differentiating cells in the cortical zone, and the stem cell niche or Posterior Signaling Center (PSC) residing at the base of the medullary zone (MZ). This arrangement facilitates investigations into how signaling from the microenvironment controls progenitor choice. The Drosophila Friend of GATA transcriptional regulator, U-shaped, is a conserved hematopoietic regulator. To identify additional novel intrinsic and extrinsic regulators that interface with U-shaped to control hematopoiesis, we conducted an in vivo screen for factors that genetically interact with u-shaped. Smoothened, a downstream effector of Hedgehog signaling, was one of the factors identified in the screen. Here we report our studies that characterized the relationship between Smoothened and U-shaped. We showed that the PSC and Hedgehog signaling are required for U-shaped expression and that U-shaped is an important intrinsic progenitor regulator. These observations identify a potential link between the progenitor regulatory machinery and extrinsic signals from the PSC. Furthermore, we showed that both Hedgehog signaling and the PSC are required to maintain a subpopulation of progenitors. This led to a delineation of PSC-dependent versus PSC-independent progenitors and provided further evidence that the MZ progenitor population is heterogeneous. Overall, we have identified a connection between a conserved hematopoietic master regulator and a putative stem cell niche, which adds to our understanding of how signals from the microenvironment regulate progenitor multipotency.


Figures

Figure 1
Figure 1. Smo acts with Ush to block lamellocyte differentiation and is required to maintain Ush expression levels.
(A–D) Smo acts with Ush to block lamellocyte (lm) differentiation. Lymph glands from (C) ush/smo double heterozgyotes had significantly increased numbers of lymph gland lobes with lamellocyte differentiation compared to either (A) smo heterozygotes or (B) ush heterozygotes. Lamellocytes were detected using the MSN-C reporter and are marked with arrows. (D) Histogram showing the results of the statistical analyses. Chi-square test; P value is as shown; smo (n=214); ush and ush/smo (n= 26). (E–G) Loss of Ush function has no effect on Smo expression. Smo expression in (F) ushvx22/r24 {ush hypomorphs) was assessed and compared to (E) wild-type controls (+). (G) Histogram showing the results of the statistical analyses. Student’s t-test; error bars show standard deviation; P values are as shown; control and ush hypomorphs (n = 15). (H–J) Loss of Smo function (SmoDN) significantly reduced Ush levels compared to controls (+). Tep-Gal4 females were crossed to control (+) males or males that carry UAS-smoDN. (J) Histogram showing the results of the statistical analyses. Student’s t-test; error bars show standard deviation; P values are as shown; control and SmoDN (n=18). White dotted lines delineate the entire lymph gland. Scale bars: panels A–C, 100 pm; remaining panels, 50 μm. Panels A–D, late-third instar larvae; panels E–J, mid-third instar larvae.
Figure 2
Figure 2. Hedgehog signaling maintains Ush expression.
Hh signaling was disrupted by (A,B) knocking down Hh expression in the PSC (Antp>HhRNAi), (C,D) over-expressing Ptc in the MZ (Tep>PtcGOF), (E,F) knocking down Ci in the MZ (Tep>CiRNAi) or (G,H) mis-expressing Ush in the PSC (Col>UshGOF). This resulted in a significant reduction in Ush expression levels. Arrow marks ectopically expressed Ush in the PSC. (I) Histogram showing that the level of Ush expression is significantly reduced in lymph glands with disrupted Hh signaling. Student’s t-test; error bars show standard deviation; P values are as shown; control and HhRNAi (n=20); control and PtcGOF (n=20); control and CiRNAi (n=24); control and UshGOF (n=22). White dotted lines delineate the entire lymph gland. Scale bars: 50 μm. Mid-third instar larvae.
Figure 3
Figure 3. Hedgehog signaling blocks blood cell differentiation.
(A–F) Hh signaling was disrupted by using Antp-Gal44 to drive UAS-hhRNAi in the PSC. This resulted in a significant increase in the number of crystal cells and plasmatocytes in mid-third instar larvae. (A,B) Crystal cells are marked with ProPO (PPO) and (D,E) plasmatocytes are marked with PI. (C,F) Histograms showing the results of the statistical analyses. Student’s t-test; error bars show standard deviation; P values are as shown; (C) control and HhRNAi (n=10); (F) control and HhRNAi (n=12). (G–J) Col-Gal4 was used to express UAS-ush or co-express UAS-ush;UAS-hh in the PSC of later third instar larvae. (G,H) Mis-expressing Ush resulted in a significant increase in lamellocyte differentiation, (G–I) which was significantly repressed by co-expressing Ush and Hh. (G–I) Lamellocytes are marked with LI. (J) Histogram showing the results of the statistical analyses. Chi-square test; P value is as shown; Col-Gal4/+ (n=14); Col>Ush (n= 15); Col>Ush;Hh (n=15). Lymph glands are counterstained with Dapi. Scale bars: 50 μm.
Figure 4
Figure 4. Ush is required to maintain the number of Odd-positive prohemocytes and the level of E-cadherin expression.
Knockdown of Ush expression in the MZ (Tep>UshRNAi) significantly reduced (A–C) the percentage of Odd-positive prohemocytes and (D–F) the E-cadherin (Ecad) expression domain compared to controls. (C,F) Histograms showing the results of the statistical analyses. Student’s t-test; error bars show standard deviation; P values are as shown; (C) control and Ush knockdown (n=12); (F) control and Ush knockdown (n=10). Lymph glands are counterstained with Dapi. White dotted lines delineate the entire lymph gland; yellow dotted line delineates the Ecad-positive prohemocyte pool. Scale bars: 50 μm. Mid-third instar larvae.
Figure 5
Figure 5. Hedgehog signaling maintains the Odd-positive and DomeMESO-positive but not Col-positive prohemocyte population.
(A–G) Disrupted Hh signaling significantly reduced the percentage of Odd-positive prohemocytes compared to controls. Hh signaling was disrupted by (A–D) reducing Hh expression in the PSC (Antp>HhRNAi or Col>UshGOF) or (E,F) loss of Ci function in the MZ (Tep>CiRNAi). (H–J) Knockdown of Hh expression in the PSC resulted in a significant reduction in the number of DomeMESO-GFP expressing prohemocytes. (K–M) Disrupting Hh signaling by mis-expressing Ush in the PSC (Col>UshGOF) significantly reduced DomeMESO-βgal expression levels. (N–P) Knockdown of Hh expression in the PSC did not significantly reduce the number of Col-positive prohemocytes. (G,J,M,P) Histograms show the results of the statistical analyses. Student’s t-test; error bars show standard deviation; P values are as shown; (G) control and HhRNAi (n=11), control and UshGOF (n=10), control and CiRNAi (n=10); (J) control and HhRNAi (n=11); (M) control and UshGOF (n=12); (P) control and HhRNAi (n=11). Mid-third instar lymph glands are counterstained with Dapi. Scale bars: 50 μm.
Figure 6
Figure 6. The PSC maintains a subpopulation of prohemocytes.
Ablation of the PSC (Col>Rpr) results in a significant reduction in (A–C) the level of Ush expression, (D–F) the percentage of Odd-positive prohemocytes, (G–I) the E-cadherin (Ecad) expression domain, (I–?) the percentage of DomeMESO-GFP-positive prohemocytes, but not (M–O) the percentage of Col-positive cells. (C,F,I,L,0) Histograms show the results of the statistical analyses. Student’s t-test; error bars show standard deviation; P values are as shown; (C) control and Rpr (n=16); (F) control and Rpr (n=10); (I) control and Rpr (n=16); (L) control and Rpr (n=12); (O) control and Rpr (n=10). (D,E,J,K,M,N) Lymph glands are counterstained with Dapi. White dotted lines delineate the entire lymph gland; yellow dotted line delineates the Ecad-positive prohemocyte pool. Scale bars: 50 μm. Mid-third instar larvae.
Figure 7
Figure 7. The PSC is required to maintain the complement of Odd-positive, but not Col-positive prohemocytes.
Ablation of the PSC (Col>Rpr) results in a significant reduction in the percentage of Odd-positive prohemocytes, but not the percentage of Col-positive cells. (A-A’”) Controls and (B-B’”) Col>Rpr. A,A’,B,B’) Lymph glands showing Col and Odd expression, (A, A’) PSC marked with yellow arrows, (A,B) counterstained with Dapi, (A”,B”) lymph glands showing only Col expression, (A’”, B’”) lymph glands showing only Odd expression. (A’-A’”) Insets showing cells that express Odd but not Col, marked with arrow. (B’-B’”) Insets showing cells with predominantly Col expression but with reduced Odd expression, marked with arrow. (C) Histogram showing that Odd-positive prohemocytes are significantly reduced in response to PSC ablation; whereas Col-positive prohemocytes are not significantly reduced in response to PSC ablation. Black connecting lines compare percentage of Odd control and experimental samples or Col control and experimental samples. Red connecting line compares percentage of Odd-positive cells in PSC ablated lymph glands with Col-positive cells in control lymph glands. Student’s t-test; error bars show standard deviation; P values are as shown; control and Rpr (n=10). White dotted lines delineate the entire lymph gland. Scale bars: 50 μm. Mid-third instar larvae.

References

    1. Crozatier M, Vincent A. Drosophila: a model for studying genetic and molecular aspects of haematopoiesis and associated leukaemias. Dis Model Mech. 2011;4:439–445. - PMC - PubMed
    1. Gold KS, Bruckner K. Macrophages and cellular immunity in Drosophila melanogaster. Semin Immunol. 2015;27:357–368. - PMC - PubMed
    1. Letoumeau M, Lapraz F, Sharma A et al. Drosophila hematopoiesis under normal conditions and in response to immune stress. FEBS Lett 2016;590:4034–4051. - PubMed
    1. Makhijani K, Bruckner K. Of blood cells and the nervous system: hematopoiesis in the Drosophila larva. Fly (Austin ). 2012;6:254–260. - PMC - PubMed
    1. Parsons B, Foley E. Cellular immune defenses of Drosophila melanogaster. Dev Comp Immunol. 2016;58:95–101. - PubMed

Publication types

MeSH terms

LinkOut - more resources