. 2018 Jul 17;115(29):E6780-E6788.
doi: 10.1073/pnas.1804309115. Epub 2018 Jul 2.

Minor zygotic gene activation is essential for mouse preimplantation development

Affiliations

Minor zygotic gene activation is essential for mouse preimplantation development

Ken-Ichiro Abe et al. Proc Natl Acad Sci U S A. .

Abstract

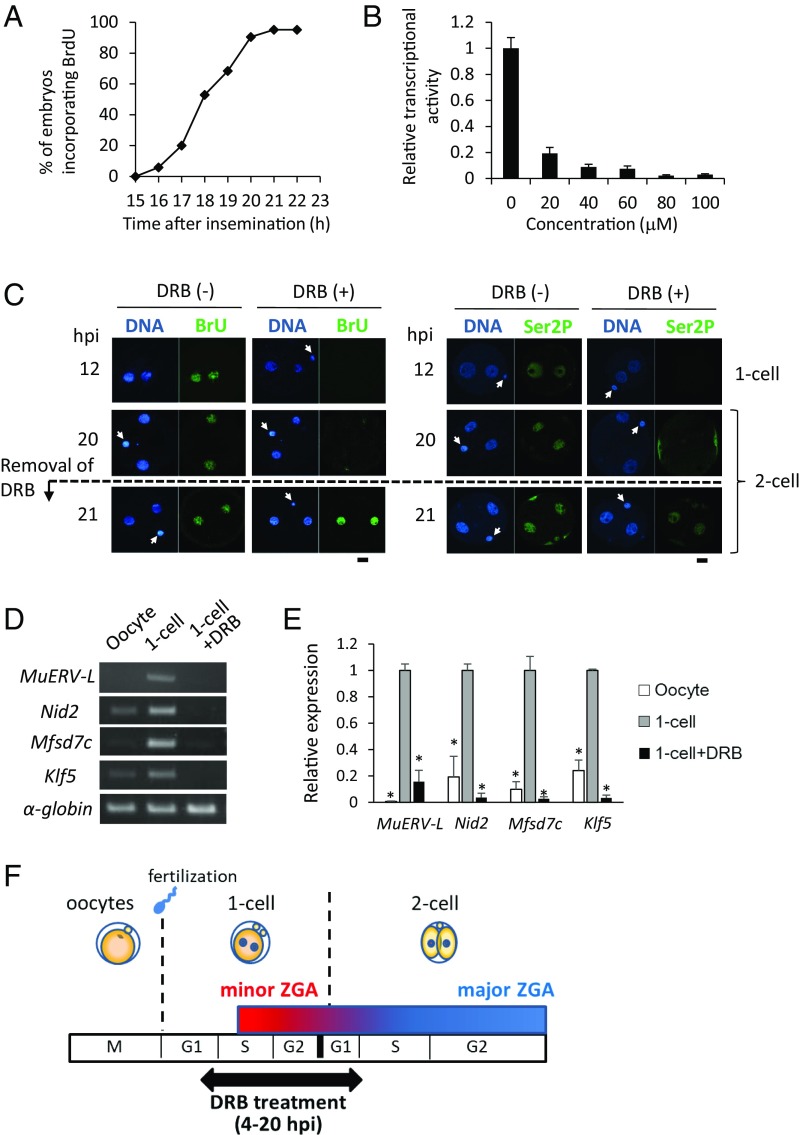
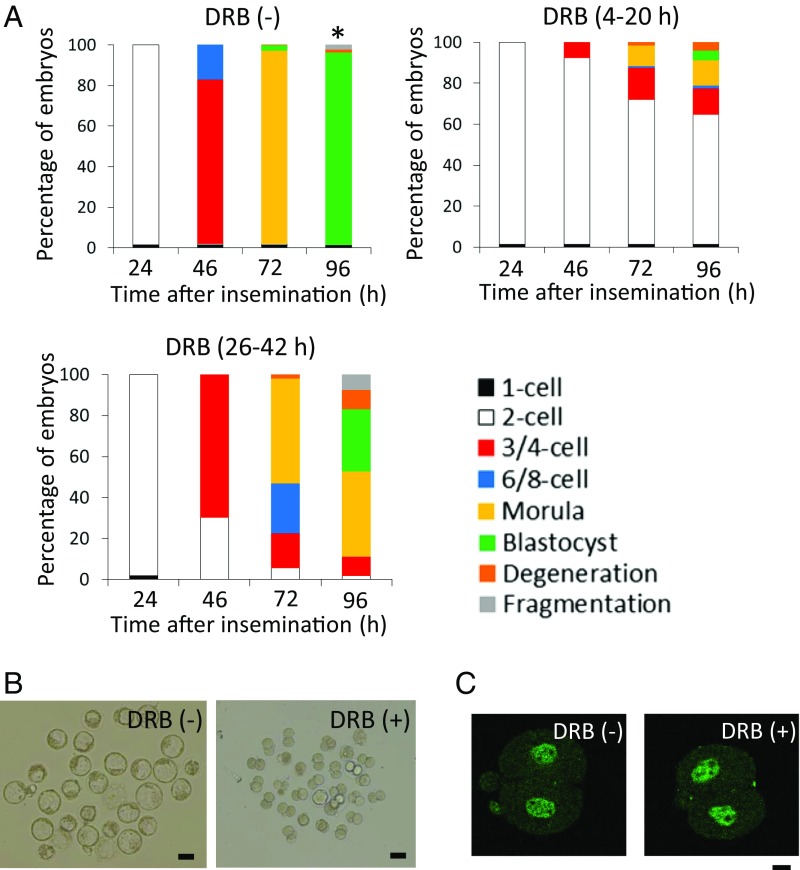
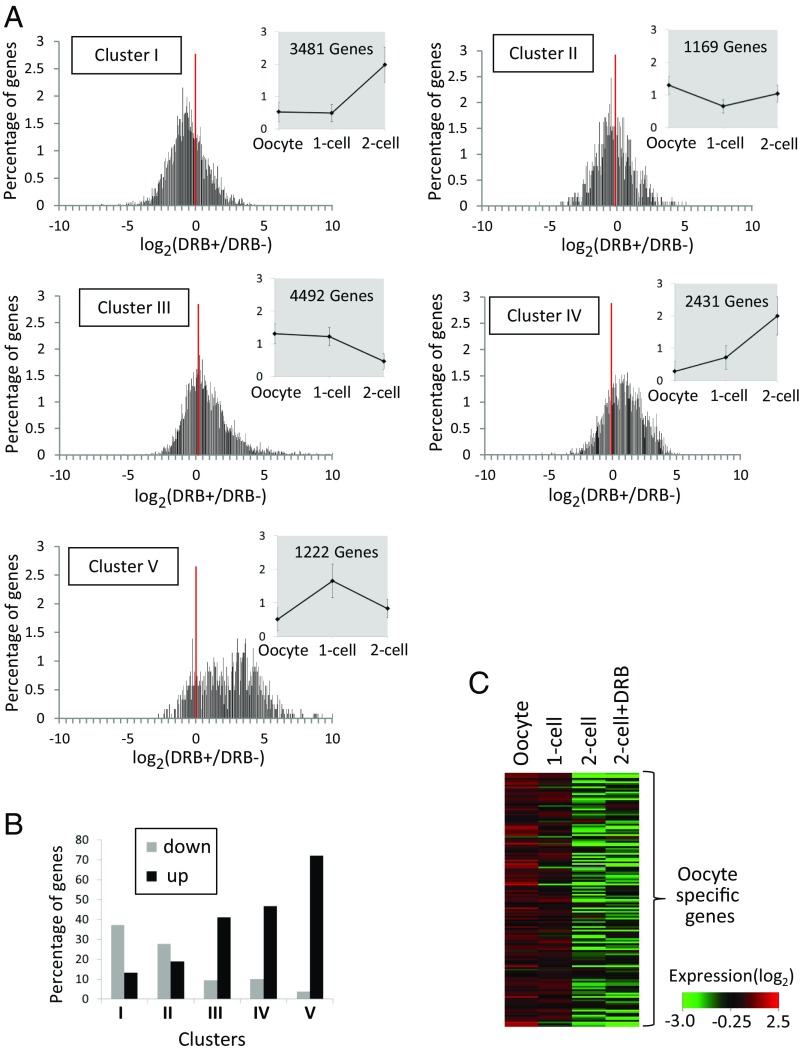
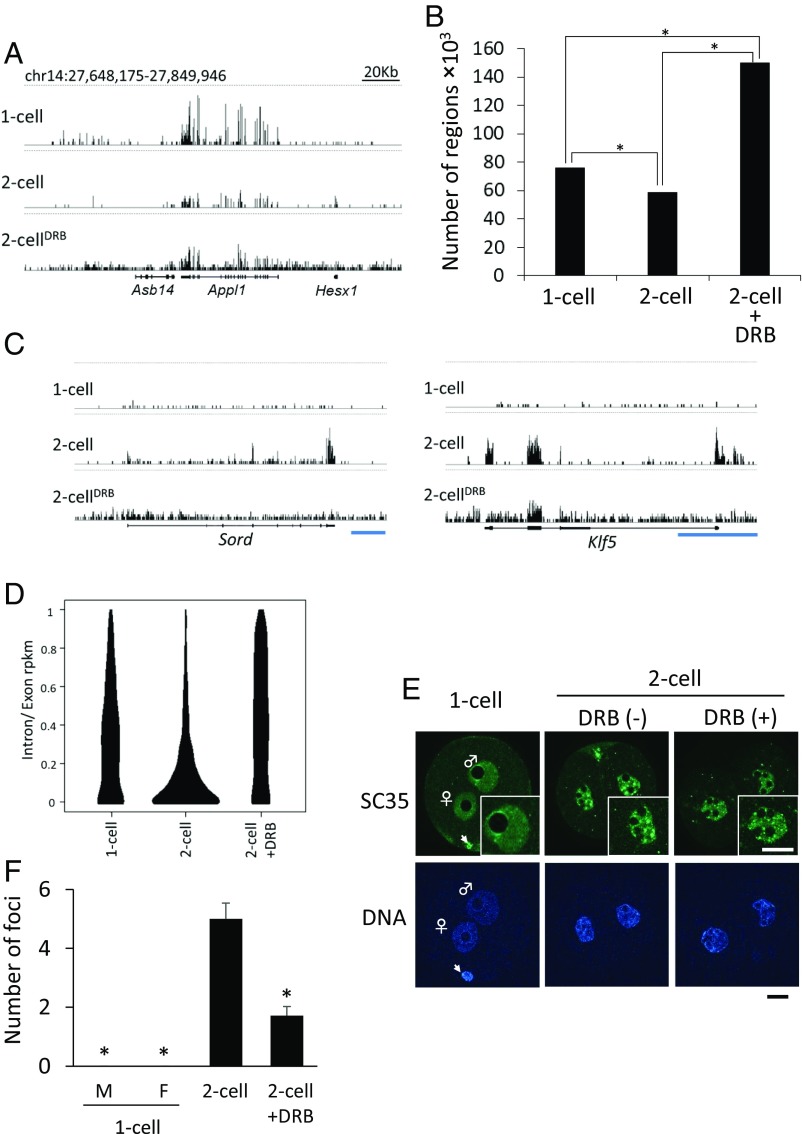
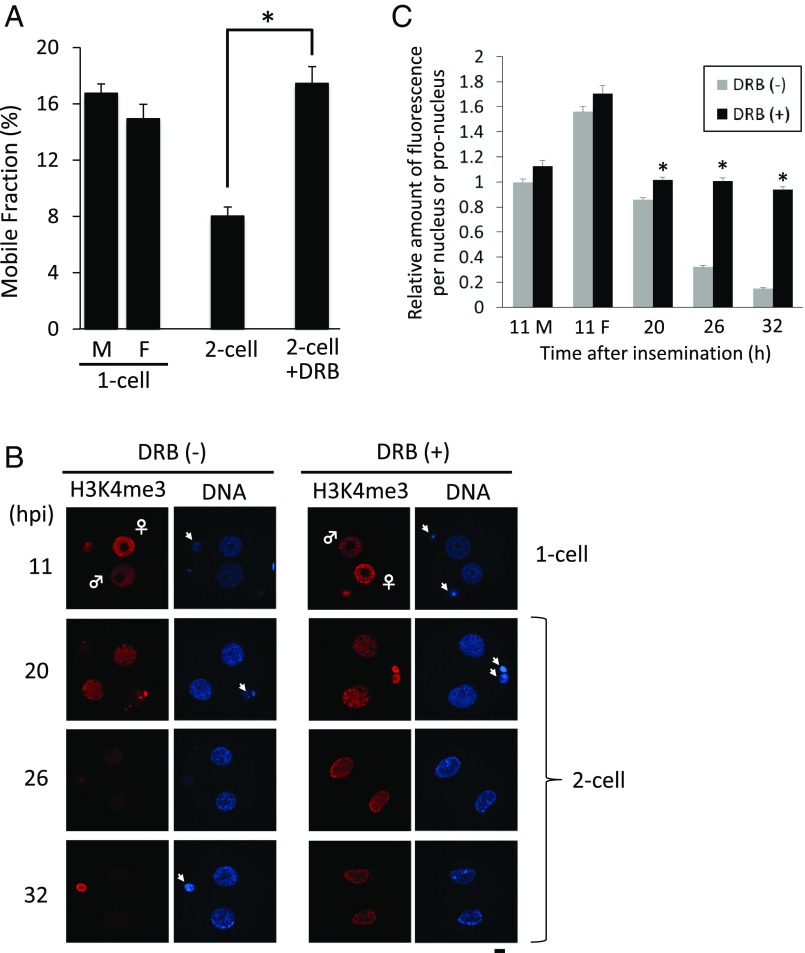
In mice, transcription initiates at the mid-one-cell stage and transcriptional activity dramatically increases during the two-cell stage, a process called zygotic gene activation (ZGA). Associated with ZGA is a marked change in the pattern of gene expression that occurs after the second round of DNA replication. To distinguish ZGA before and after the second-round DNA replication, the former and latter are called minor and major ZGA, respectively. Although major ZGA are required for development beyond the two-cell stage, the function of minor ZGA is not well understood. Transiently inhibiting minor ZGA with 5, 6-dichloro-1-β-d-ribofuranosyl-benzimidazole (DRB) resulted in the majority of embryos arresting at the two-cell stage and retention of the H3K4me3 mark that normally decreases. After release from DRB, at which time major ZGA normally occurred, transcription initiated with characteristics of minor ZGA but not major ZGA, although degradation of maternal mRNA normally occurred. Thus, ZGA occurs sequentially starting with minor ZGA that is critical for the maternal-to-zygotic transition.

Keywords: gene expression; maternal-to-zygotic transition; minor zygotic gene activation; preimplantation mouse embryo.


Conflict of interest statement

The authors declare no conflict of interest.

Figures

Fig. 1.
Fig. 1.
DRB reversibly inhibits minor ZGA. (A) Timing of S phase during the two-cell stage. DNA replication was determined by incorporation of BrdU. The percentage of embryos that incorporated BrdU was determined at the indicated times. More than 20 embryos were observed in each time point. (B) Minimum concentration of DRB required for maximal inhibition of transcription during minor ZGA. Embryos were treated with the indicated concentrations of DRB between 4 and 12 hpi and transcriptional activity measured at 12 hpi. Transcriptional activity in control untreated embryos was set as 1 and the relative transcriptional activities were calculated for the other samples. More than 20 pronuclei were analyzed in each sample and the data are presented as the mean ± SEM. (C) Validation of inhibition of transcription and recovery of transcriptional activity (Left) and phosphorylated RNA polymerase II (Right). Embryos were cultured in DRB-containing medium between 4 and 20 hpi and then transferred into the DRB-free medium. The embryos were collected 12, 20, and 21 hpi for determination of transcriptional activity and phosphorylation of RNA polymerase II on the C-terminal Ser2 (Ser2P). Arrowheads indicate polar bodies. More than 20 pronuclei and nuclei were examined in each sample. (Scale bars, 20 µm.) (D and E) DRB inhibits expression of genes transcribed during minor ZGA. Embryos were treated with DRB between 4 and 12 hpi. The MII eggs and one-cell embryos collected at 12 hpi were subjected to RT-PCR assay; rabbit α-globin mRNA was used as an external control. The experiment was performed three times and similar results were obtained. Shown is a representative example (D). The densities of PCR bands were quantified by using image analyzer (E). Data are represented as mean ± SEM. Asterisks indicate a significant difference from the control one-cell embryos (Student’s t test; P < 0.05). (F) Schematic representation of transient inhibition of minor ZGA. The embryos were cultured in the KSOM medium containing 80 µM DRB from 4 to 20 hpi and then transferred to the DRB-free medium.
Fig. 2.
Fig. 2.
Effect of transiently inhibiting minor ZGA on preimplantation development. (A) Development of embryos transiently treated with DRB. DRB (−) indicates embryos treated with DMSO, the solvent for DRB, between 4 and 20 hpi. DRB (4–20 h) and DRB (26–42 h) represent embryos that were treated with DRB between 4 and 20 h and between 26 and 42 hpi, respectively. The y axis shows percentages of embryos that developed to the indicated developmental stages. Asterisks represent significant differences by χ2 test (P < 0.05). The experiment was performed three times and >30 embryos were analyzed for each experiment. (B) Morphology of embryos treated with or without DRB at 96 hpi. DRB (−) and (+) represent embryos treated with DMSO and DRB, respectively, between 4 and 20 hpi. (Scale bars, 100 μm.) (C) Detection of the second round of DNA replication in DRB-treated embryos. The embryos were cultured with DRB between 4 and 20 hpi and then transferred to DRB-free medium containing BrdU. After 6 h of incubation, incorporated BrdU were detected by immunocytochemistry with anti-BrdU antibody. The experiments were conducted three times and more than 10 embryos were analyzed in each experiment. Incorporation of BrdU was detected in 96.1% of embryos analyzed. (Scale bars, 20 µm.)
Fig. 3.
Fig. 3.
Effect of transiently inhibiting minor ZGA by DRB on the transcriptome of late-stage two-cell embryos. RNA-seq was conducted for DRB-treated embryos 12 h after removal of DRB (32 hpi). These data and those obtained in the previous study [MII eggs, one- (13 hpi), and two-cell–stage embryos (32 hpi)] (5) were used for analysis of gene expression. (A) Line graphs with gray background: classification of genes by k-means nonhierarchical clustering analysis based on their expression patterns in MII eggs, one-cell, and two-cell embryos treated with DRB. Mapped genes with <11 reads were omitted from the analysis. The average expression levels in the MII eggs, and one- and two-cell–stage embryos were set as 1. Error bars represent SD. Histograms with white background: distribution of up- and down-regulated transcripts in response to DRB in each cluster. The x axis represents the logarithm of the ratio of their expression levels between embryos treated with DRB (DRB+) and those not treated with the DRB (DRB−). The y axis represents the percentage of transcripts with particular DRB+/DRB− ratio in total number belonging to each cluster. The red vertical line represents the position of 0 at which the DRB+/DRB− ratio was 1.0. (B) The percentage of genes up- or down-regulated following transient inhibition of minor ZGA in each cluster. Transcripts whose expression levels were more than two times higher or less than a half, respectively, in the DRB-treated embryos than DRB-untreated ones, were defined as up- or down-regulated, respectively. (C) Analysis of the degradation pattern of 149 oocyte-specific transcripts (5) in MII eggs, one-cell–stage embryos, and two-cell–stage embryos treated with and without DRB.
Fig. 4.
Fig. 4.
Transcription with the characteristics of minor ZGA in DRB-treated two-cell stage embryos. Embryos were cultured with DRB from 4 to 20 hpi and transferred to DRB-free medium. (A) Screenshots from the University of California, Santa Cruz (UCSC) genome browser (51) of RNA-seq data in one-cell embryos (13 hpi) and two-cell embryos (32 hpi) treated with and without DRB. The vertical scale was trimmed to 0–20 reads; trimming is indicated by horizontal dashed lines. (B) Quantification of the number of transcribed intergenic regions in one-cell embryos and two-cell embryos treated with or without DRB. Intergenic regions were divided into 1-kb regions across the genome and then the number of regions that were uniquely mapped by at least a single read was counted. Asterisks indicate significant differences by χ2 test (P < 0.05). (C) Distribution of the mapped reads of Sord and Klf5 that are transcribed during both of minor and major ZGA but not in oocytes. Shown are RNA sequencing data from one-cell embryos and two-cell embryos treated with or without DRB visualized using the UCSC genome browser. The vertical scale was trimmed to 0–20 reads. Dashed lines indicate trimming at 20 reads. An exon–intron structure of each gene is described under the screenshot. (Blue scale bars, 5 kb.) (D) Violin plot representing intron RPKM/exon RPKM (intron and exon read counts normalized to 1-kb length) ratios for transcripts expressed in embryos but not in MII eggs. (E) Images of serine/arginine-rich splicing factor 2 (SC35) immunocytochemical staining in pronuclei of one-cell embryos and nuclei of two-cell embryos treated with [DRB(+)] and without DRB [DRB(−)]. Insets represent the magnified images. The experiment was conducted two times and six nuclei were examined for each experiment. (Scale bars, 20 μm.) Arrowheads indicate polar bodies. (F) The number of SC35 foci in the nucleus/pronucleus in the immunofluorescence images of E. The foci whose size occupied more than 0.03% of the area of whole embryos were recognized as those of SC35. Data are represented as mean ± SEM. Asterisks indicate a significant difference from the control two-cell embryos (Student’s t test; P < 0.05).
Fig. 5.
Fig. 5.
Deficiency in the formation of tight chromatin structure and demethylation of H3K4me3 in DRB-treated two-cell–stage embryos. Embryos were cultured with DRB from 4 to 20 hpi and transferred to DRB-free medium. (A) Embryos at the one- and two-cell stages and DRB-treated two-cell–stage embryos were subjected to FRAP for analysis of chromatin structure. The embryos were collected at 11 and 26 hpi for one- and two-cell–stage embryos, respectively. M and F represent male and female pronuclei, respectively, in one-cell embryos. The experiment was reproducible at three times and more than seven embryos were examined. Asterisks indicate a significant difference from the control two-cell embryos (Student’s t test; P < 0.05). Data are represented as mean ± SEM. (B) Embryos at the one- and two-cell stages and DRB-treated two-cell–stage embryos were subjected to immunocytochemistry with an anti-H3K4me3 antibody at 11, 20, 26, and 32 hpi. (Scale bar, 10 μm.) Arrowheads indicate polar bodies. (C) Quantification of H3K4me3 signal in the images of immunocytochemistry in B. Three independent experiments were performed and 8–12 embryos were analyzed in total at each time point. Data are represented as mean ± SEM. An asterisk represents significant differences (by Student’s t test; P < 0.01).

References

    1. Bleil JD, Wassarman PM. Mammalian sperm-egg interaction: Identification of a glycoprotein in mouse egg zonae pellucidae possessing receptor activity for sperm. Cell. 1980;20:873–882. - PubMed
    1. McGrath SA, Esquela AF, Lee SJ. Oocyte-specific expression of growth/differentiation factor-9. Mol Endocrinol. 1995;9:131–136. - PubMed
    1. Rajkovic A, Matzuk MM. Functional analysis of oocyte-expressed genes using transgenic models. Mol Cell Endocrinol. 2002;187:5–9. - PubMed
    1. Moore GPM, Lintern-Moore S. A correlation between growth and RNA synthesis in the mouse oocyte. J Reprod Fertil. 1974;39:163–166. - PubMed
    1. Abe K, et al. The first murine zygotic transcription is promiscuous and uncoupled from splicing and 3′ processing. EMBO J. 2015;34:1523–1537. - PMC - PubMed

Publication types

MeSH terms

Substances