. 2018 Jul 17;115(29):7545-7550.
doi: 10.1073/pnas.1801095115. Epub 2018 Jul 2.

Opposite outcomes of coinfection at individual and population scales

Affiliations

Opposite outcomes of coinfection at individual and population scales

Erin E Gorsich et al. Proc Natl Acad Sci U S A. .

Abstract

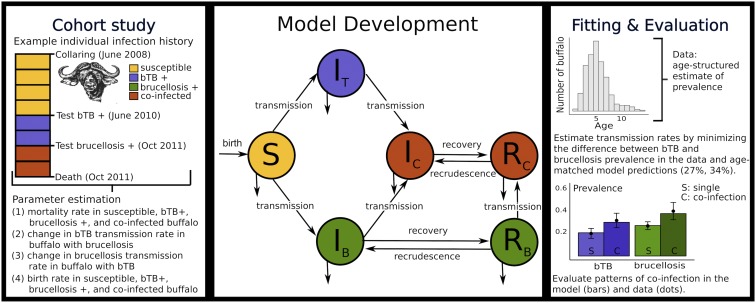
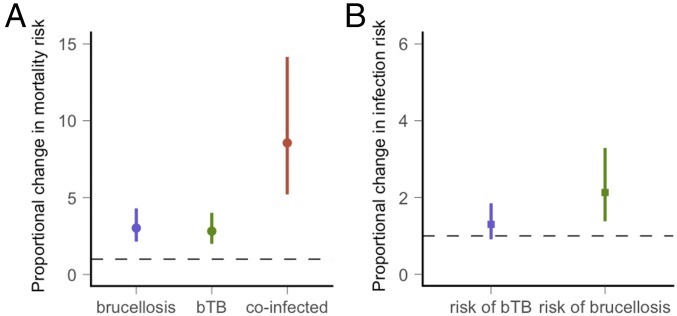
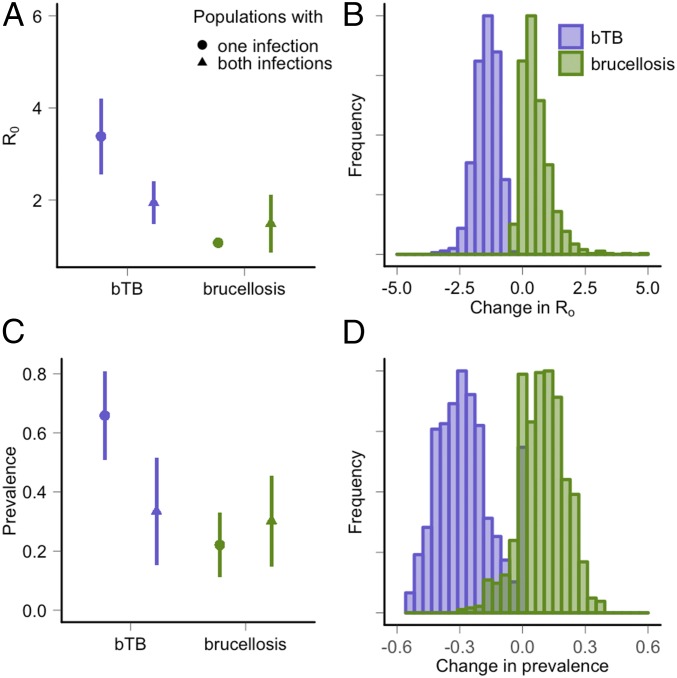
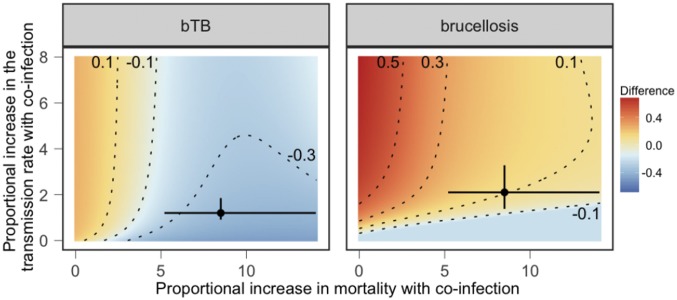
Coinfecting parasites and pathogens remain a leading challenge for global public health due to their consequences for individual-level infection risk and disease progression. However, a clear understanding of the population-level consequences of coinfection is lacking. Here, we constructed a model that includes three individual-level effects of coinfection: mortality, fecundity, and transmission. We used the model to investigate how these individual-level consequences of coinfection scale up to produce population-level infection patterns. To parameterize this model, we conducted a 4-y cohort study in African buffalo to estimate the individual-level effects of coinfection with two bacterial pathogens, bovine tuberculosis (bTB) and brucellosis, across a range of demographic and environmental contexts. At the individual level, our empirical results identified bTB as a risk factor for acquiring brucellosis, but we found no association between brucellosis and the risk of acquiring bTB. Both infections were associated with reductions in survival and neither infection was associated with reductions in fecundity. The model reproduced coinfection patterns in the data and predicted opposite impacts of coinfection at individual and population scales: Whereas bTB facilitated brucellosis infection at the individual level, our model predicted the presence of brucellosis to have a strong negative impact on bTB at the population level. In modeled populations where brucellosis was present, the endemic prevalence and basic reproduction number ([Formula: see text]) of bTB were lower than in populations without brucellosis. Therefore, these results provide a data-driven example of competition between coinfecting pathogens that occurs when one pathogen facilitates secondary infections at the individual level.

Keywords: African buffalo; brucellosis; coinfection; competition; tuberculosis.


Conflict of interest statement

The authors declare no conflict of interest.

Figures

Fig. 1.
Fig. 1.
Conceptual diagram of the data, model, and evaluation. (Center) A schematic representation of the disease model defined in SI Appendix, section 2. Hosts are represented as susceptible (S), infected with bTB only (IT), infected with brucellosis only (IB), coinfected with both infections (IC), persistently infected with brucellosis only but no longer infectious (RB), and persistently infected with brucellosis but no longer infectious and coinfected with bTB (RC). (Left) A detailed cohort study informs model parameterization by quantifying the mortality, transmission, and fecundity consequences of coinfection (Right) as well as the transmission parameters for both infections. (Right) The prevalence plot illustrates that the model accurately reproduces coinfection patterns in the data. The bars represent the proportion of single (S) and coinfected (C) individuals in the model results and the solid circles represent the data.
Fig. 2.
Fig. 2.
Parameter estimation based on Cox proportional hazards analyses of the cohort study. (A) The predicted median and SE for the proportional change in mortality when buffalo are infected with brucellosis or bTB or coinfected relative to uninfected buffalo. (B) The predicted estimates for the proportional change in infection risk when buffalo are infected with another pathogen relative to the risk in uninfected buffalo. The dashed line indicates no change in risk.
Fig. 3.
Fig. 3.
Model predictions of the reciprocal consequences of coinfection in populations where one or both pathogens occur. Purple represents the model predictions of (A and B) R0 and (C and D) prevalence for bTB; green represents predictions of R0 and prevalence for brucellosis. For example, the purple circles and lines represent the median and SE prediction for bTB in populations where only bTB occurs. The purple triangles represent the prediction for bTB in populations where both pathogens are present. We used Monte Carlo sampling to quantify the uncertainty in model outcomes due to uncertainty in the parameters describing the individual-level consequences of coinfection (Fig. 2 and SI Appendix, section 2). (A) The estimated R0 for bTB was lower in populations where brucellosis co-occurs while the estimated R0 for brucellosis was similar in populations with and without bTB. (B) Histograms showing the difference in R0 in populations where one or both pathogens are present. For each parameter set, change is calculated as the predicted value of bTB prevalence (purple) or brucellosis prevalence (green) in populations with coinfection subtracted by the predicted value in populations with a single pathogen. (C) The estimated prevalence of bTB was lower in populations where brucellosis co-occurs, while the estimated prevalence of brucellosis was similar in populations with and without bTB. (D) Histograms showing the difference in prevalence in populations where one or both pathogens are present.
Fig. 4.
Fig. 4.
The difference between predicted (Left) bTB or (Right) brucellosis prevalence values in populations where one or both pathogens are present. The axes represent a range of transmission rate and mortality consequences of coinfection. Proportional increases in mortality represent the mortality rate in coinfected individuals divided by the rate in susceptible individuals. Proportional increases in the transmission rate represent the transmission rate of the focal pathogen in individuals infected with the second pathogen divided by the transmission rate of the focal pathogen for susceptible individuals. Red indicates that the prevalence of the focal pathogen is higher in populations where the second pathogen is present; blue indicates that the prevalence of the focal pathogen is lower in populations where the second pathogen is present; yellow indicates no change. Contour lines indicate changes in prevalence by 20%. Circles and error bars indicate median and SE parameter values estimated in the data.

References

    1. Griffiths EC, Pedersen AB, Fenton A, Petchey OL. The nature and consequences of coinfection in humans. J Infect. 2011;63:200–206. - PMC - PubMed
    1. Gandhi NR, et al. Extensively drug-resistant tuberculosis as a cause of death in patients co-infected with tuberculosis and HIV in a rural area of South Africa. Lancet. 2006;368:1575–1580. - PubMed
    1. Alter MJ. Epidemiology of viral hepatitis and HIV co-infection. J Hepatol. 2006;44:S6–S9. - PubMed
    1. Beechler BR, et al. Enemies and turncoats: Bovine tuberculosis exposes pathogenic potential of Rift Valley fever virus in a common host, African buffalo. Proc R Soc Lond B Biol Sci. 2015;282:20142942. - PMC - PubMed
    1. Graham AL, Lamb TJ, Read AF, Allen JE. Malaria-filaria coinfection in mice makes malarial disease more severe unless filarial infection achieves patency. J Infect Dis. 2005;191:410–421. - PubMed

Publication types

LinkOut - more resources