. 2018 Sep 3;217(9):3267-3283.
doi: 10.1083/jcb.201712085. Epub 2018 Jul 2.

Shedding of CD16 disassembles the NK cell immune synapse and boosts serial engagement of target cells

Affiliations

Shedding of CD16 disassembles the NK cell immune synapse and boosts serial engagement of target cells

Katja Srpan et al. J Cell Biol. .

Abstract

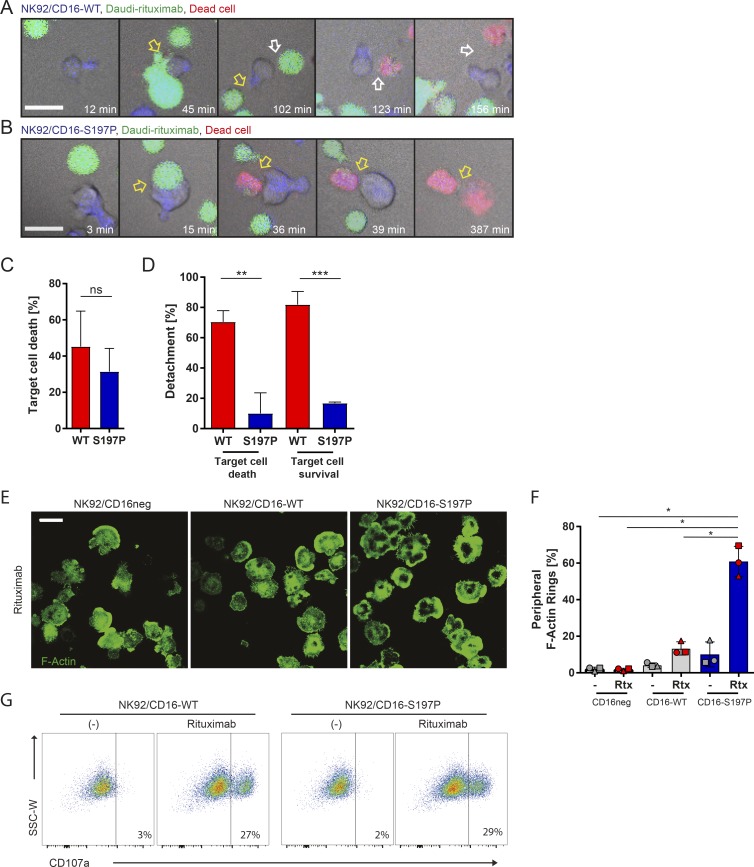
Natural Killer (NK) cells can engage multiple virally infected or tumor cells sequentially and deliver perforin for cytolytic killing of these targets. Using microscopy to visualize degranulation from individual NK cells, we found that repeated activation via the Fc receptor CD16 decreased the amount of perforin secreted. However, perforin secretion was restored upon subsequent activation via a different activating receptor, NKG2D. Repeated stimulation via NKG2D also decreased perforin secretion, but this was not rescued by stimulation via CD16. These different outcomes of sequential stimulation could be accounted for by shedding of CD16 being triggered by cellular activation. The use of pharmacological inhibitors and NK cells transfected to express a noncleavable form of CD16 revealed that CD16 shedding also increased NK cell motility and facilitated detachment of NK cells from target cells. Disassembly of the immune synapse caused by CD16 shedding aided NK cell survival and boosted serial engagement of target cells. Thus, counterintuitively, shedding of CD16 may positively impact immune responses.


Figures

Figure 1.
Figure 1.
Effective restimulation of NK cells is receptor dependent. (A–I) NK cells were sequentially activated through CD16 and NKG2D on slides coated with either rituximab (Rtx) or MICA and both with ICAM-1. Slides were also coated with anti-perforin mAb to capture secreted perforin, which was visualized by a noncompeting Alexa Fluor 488–labeled anti-perforin mAb. (A) Schematic representation of experimental approach. NK cells were sequentially incubated for 1 h on differently coated surfaces as indicated. (B) Representative images of perforin secreted from one cell during sequential stimulations. Bars, 10 µm. (C and F) Quantitative analysis of perforin secreted by cells from a representative donor. Each point is the integrated fluorescence intensity (IFI) of perforin captured from one cell (median ± interquartile range [IQR]). (D and G) Median IFI values of perforin secretion from different donors (n = 6; mean ± SEM; symbols represent different donors). (E and H) Intracellular (IC) perforin levels were assessed by flow cytometry upon each round of stimulation. Graphs represent geometric mean fluorescence intensity (gMFI) values (n = 3; mean ± SD; symbols represent different donors). (I) Comparison of gMFI values of intracellular perforin upon two rounds of stimulation on either rituximab or MICA. *, P < 0.05; **, P < 0.01; ****, P < 0.0001 calculated by Kruskal-Wallis test (C and F), Friedman test (D, E, G, and H), or Student’s t test (I). US, unstimulated. See also Figs. S1, S2, and S3.
Figure 2.
Figure 2.
Receptor expression varies with serial engagement. (A–F) NK cells were sequentially stimulated through CD16 and NKG2D on surfaces coated with either rituximab (Rtx) or MICA and both with ICAM-1 as schematically represented in Fig. 1 A (1 h at each step). Then, CD16 and NKG2D levels were assessed by flow cytometry. Histograms represent surface expression of CD16 (A and B) and NKG2D (C and D) after each step as indicated. (A and B) The vertical line denotes the point at which NK cells were considered as CD16+. Numbers denote the percent of CD16+ cells from a representative donor. Graphs show the gMFI of CD16 expression of CD16+ populations normalized to unstimulated (US) control cells. (C and D) gMFI of NKG2D expression from the total NK cell population. (E and F) NK cell viability after each stimulation. n = 7; symbols represent different donors; mean ± SD. *, P < 0.05; **, P < 0.01; ***, P < 0.001; ****, P < 0.0001 calculated by one-way ANOVA.
Figure 3.
Figure 3.
Expression of a noncleavable form of CD16 prevents reduction of perforin in sequential stimulation. (A) Schematic representation of CD16-WT and CD16-S197P indicating a single point mutation, S197P, which renders CD16 insensitive to ADAM17. (B) The NK92 cell line was transduced to express CD16-WT or CD16-S197P. Representative histograms of surface CD16 on parental cell line (gray) and NK92/CD16-WT or NK92/CD16-S197P before (black) and after activation with Daudi-rituximab (Rtx; red) or PMA/ionomycin (orange). The same histogram for a parental cell line is shown in both panels. (C) CD16 expression levels normalized to unstimulated (US) CD16+ cells (n = 5 independent experiments; mean ± SD). (D and E) Transfected NK92 cells were sequentially activated through CD16 on slides coated with rituximab and ICAM-1. Secreted perforin was captured with anti-perforin mAb and visualized by a noncompeting Alexa Fluor 488–labeled anti-perforin mAb. Median fluorescence of perforin for NK92/CD16-WT (D) or NK92/CD16-S197P (E). n = 7; mean ± SEM; symbols represent different experiments. **, P < 0.01 calculated by two-way ANOVA (C) or Friedman test (D and E).
Figure 4.
Figure 4.
NK cell prestimulation can affect subsequent target cell lysis. (A–D) Primary NK cells were prestimulated with P815, Daudi, Daudi-rituximab (Rtx), or Daudi-MICA. Unstimulated NK cells were used as a control. After 1.5 h incubation, Daudi-rituximab or Daudi-MICA cells labeled with cell trace dye (#) were added and incubated for an additional 1.5 h. (A) Schematic representation of experimental setup. (B) Representative plots of target cell death measured by staining caspase 3/7 activity and assessed by flow cytometry gated on labeled target cells (#). Percentage of caspase 3/7–positive Daudi-rituximab (C) and Daudi-MICA (D). n = 7; mean ± SD; symbols represent different donors. *, P < 0.05; **, P < 0.01 calculated by one-way ANOVA. SSC-W, side scatter–width. See also Fig. S4.
Figure 5.
Figure 5.
NK cell serial killing of target cells expressing different ligands is determined by the order of engagement. (A–J) NK cells were incubated with both Daudi-rituximab and Daudi-MICA at an E:T:T of 1:1.5:1.5 in microwells. Images were captured every 3 min for 8 h. (A) Representative image of one well (450 × 450 µm2) in fluorescence overlaid onto brightfield. NK cells are shown in cyan, Daudi-rituximab (Rtx) in blue, Daudi-MICA in green, and dead cells in red. Bar, 100 µm. (B) Representative images of enlarged regions from one microwell with time indicated. Bar, 20 µm. The example sequence shows how an NK cell (cyan) contacted a Daudi-rituximab (blue, 15 min) and killed it (36 min; yellow arrow). The NK cell detached, encountered a Daudi-MICA (green, 156 min) and killed it (168 min; target cell loses green fluorescence and begins to turn red; white arrow). Both targets were dead (red), whereas the NK cell remained alive (234 min). (C) Time required to lyse Daudi-rituximab and Daudi-MICA from initial contact (median ± IQR). (D) Time for target cell lysis stratifying initial and successive kills (median ± IQR). (E) Percentage of target cell lysis when Daudi-rituximab was encountered after contact with another Daudi-rituximab or Daudi-MICA. (F) Percentage of Daudi-MICA lysis when Daudi-MICA was met after Daudi-rituximab or Daudi-MICA. (G–J) Time-lapse microscopy was analyzed to record the outcome of different combinations of sequential interactions. Either no targets were killed (No kill), only the first (1st) or only the second (2nd) target was killed, or both were killed. Interactions that were unclear, e.g., many cells clustered together, were excluded from analysis. Graphs show the percentage of target cells killed from the following sequential encounters; (G) Daudi-rituximab then Daudi-rituximab, (H) Daudi-MICA then Daudi-MICA, (I) Daudi-rituximab then Daudi-MICA, and (J) Daudi-MICA then Daudi-rituximab. n = 231 interactions from three independent experiments; mean ± SD. *, P < 0.05; **, P < 0.01; ***, P < 0.001 by Mann Whitney test (C), Kruskal-Wallis test (D), Student's t test (E and F), or one-way ANOVA (G–J).
Figure 6.
Figure 6.
Activation via CD16 triggers the assembly of a cytolytic kinapse. (A) NK cells were incubated for 5 min on slides coated with rituximab (Rtx) or MICA, both with ICAM-1, or ICAM-1 alone (−) and then fixed. Panels show representative confocal images of F-actin stained with Alexa Fluor 488–labeled phalloidin. (B) Cells were scored according to their F-actin distribution; dense symmetrical rings (gray) accumulated asymmetrically at the leading edge (yellow) or more evenly distributed across the interface (green). n = 3 independent experiments. (C) IRM live-cell imaging of the contact between NK cells and glass slides coated with rituximab or MICA, both with ICAM-1. An overlay of all 360 frames (6 min at one frame per second) is shown colored according to time. Bars, 20 µm. (D and E) Surface area (D) and circularity (E) of cells was analyzed. Circularity values approaching 1 indicate a more circular shape, whereas 0 indicates an elongated shape (n = 3 independent experiments; mean ± SEM). (F) NK cell motility on activating surfaces. NK cells were labeled with Calcein and allowed to settle on surfaces coated with ICAM-1 alone (−), rituximab, or MICA, both with ICAM-1 ±1 µM TAPI-0 (where indicated). Images were acquired every 30 s for 45 min, and cells were tracked using Cell Tracker, a MATLAB plugin. n = 20 individual cell tracks from one representative donor. Axes are ±300 µm. (G) Speed of NK cells on differently coated surfaces. Each point represents the average speed of an individual cell from a representative donor (median ± IQR). (H) Mean NK cell speed (n = 4 different donors; mean ± SEM). *, P < 0.05; **, P < 0.01; ***, P < 0.001; ****, P < 0.0001 calculated by Kruskal-Wallis test (G) or one-way ANOVA (H). See also Fig. S5 and Videos 1 and 2.
Figure 7.
Figure 7.
Inhibition of CD16 shedding impairs detachment of NK cells from opsonized target cells. (A–M) NK cells were incubated in microwells (50 × 50 µm2 [A–F] or 450 × 450 µm2 [G–M]) with Daudi-rituximab ± TAPI-0 and imaged every 3 min for 8 h. Images show fluorescence and brightfield images overlaid. (A) Representative image of 81 wells (50 × 50 µm2) showing NK cells (blue), Daudi-rituximab (green), and dead cells (red). Yellow indicates cells beginning to die. (B and C) Representative time-lapse images of individual wells at times indicated. Bars, 20 µm. (B) NK cell (blue) formed a conjugate with a target cell (green; 0 min; yellow arrow). The NK cell formed a contact with another target (white arrow, 126 min). First target cell was killed (234 min), the NK cell detached from killed cell (249 min) and detached from the second target without killing (315 min). (C) In the presence of TAPI-0, an NK cell contacted two targets (15 min; yellow and white arrows), and both were killed (42 and 114 min), but the NK cell was unable to detach (480 min). (D) Percentage of interactions that resulted in target cell lysis (mean ± SD). (E) Percentage of NK cells that detached from target cells whether or not the target cell was lysed (mean ± SD). (F) The duration of all cytolytic NK cell–target cell contacts. Each point represents an individual contact. Contacts still intact at the end of the acquisition (480 min) are plotted in yellow. These points underestimate the true contact time (median ± IQR). n = 886 interactions from five independent experiments; symbols indicate different donors. (G and H) Representative time-lapse zoomed-in regions from 450 × 450 µm2 microwells. Bars, 20 µm. (G) An NK cell (blue) formed a contact with Daudi-rituximab (green; 21 min; yellow arrow). After target cell lysis (24 min), the NK cell detached and moved onto a second target (51 min; white arrow). The second target was not killed, and the NK cell detached (213 min). (H) With TAPI-0, an NK cell contacted a target cell (3 min; yellow arrow). After target cell lysis (105 min), the NK cell did not detach and itself died (351 min). (I) Percentage of all NK cell–target cell interactions that resulted in target cell lysis. (J) Percentage of NK cells that detached from Daudi-rituximab cells whether or not the target cell was lysed. (K) Average time that NK cells were in contact with a target cell in which the target cell was lysed. Conjugates that remained attached at the end of the acquisition are plotted in yellow (median ± IQR; each point represents an individual contact). (L) Percentage of NK cells that died after target cell contact. (M) Percentage of NK cells that died after failing to detach. Mean ± SD; symbols indicate different donors. n = 705 interactions from six independent experiments. *, P < 0.05; **, P < 0.01; ****, P < 0.0001 calculated by Student’s t test (D, I, L, and M), one-way ANOVA (E and J), or Mann-Whitney test (F and K). See also Videos 3 and 4.
Figure 8.
Figure 8.
Expression of a noncleavable form of CD16 leads to prolonged contacts with opsonized target cells. (A and B) NK92/CD16-WT or NK92/CD16-S197P cells were incubated with Daudi-rituximab (Rtx) in 450 × 450 µm2 microwells. Representative time lapse–enlarged regions show composite fluorescence and brightfield images. NK cells (blue), Daudi-rituximab (green), and dead cells (red) at times indicated. Bars, 20 µm. (A) An NK92/CD16-WT cell (blue) formed a contact with Daudi-rituximab (green; 45 min; yellow arrow). The NK92 cell detached without killing and established a contact with a new target (102 min; white arrow). The second target cell was killed (123 min), and the NK92 cell was detached (156 min). (B) An NK92/CD16-S197P cell formed a contact with a target cell (15 min; yellow arrow) and killed it (36 min). The NK92/CD16-S197P cell died while still attached (387 min). (C) Percentage of NK cell–target interactions that resulted in target cell lysis. (D) Percentage of NK cells that detached by the end of the acquisition. n = 195 interactions from three independent experiments (mean ± SD). (E and F) NK92 cells and transfectants were incubated on surfaces coated with ICAM-1 (−) or ICAM-1 with rituximab for 5 min. Cells were fixed and stained with Alexa Fluor 488–labeled phalloidin marking F-actin. (E) Representative images of spreading on rituximab with ICAM-1. Bars, 20 µm. (F) Percentage of NK92 cells forming dense peripheral rings of F-actin. n = 3 independent experiments (mean ± SD). (G) Representative dot plot assessing the degranulation marker, CD107a, by flow cytometry. NK92 cells and transfectants were activated on ICAM-1 (−) or rituximab with ICAM-1 for 4 h. **, P < 0.01; ***, P < 0.001 calculated by Student’s t test (C) or one-way ANOVA (D and F). SSC-W, side-scatter–width.
Figure 9.
Figure 9.
In a 3D environment, CD16 shedding allows more interactions with target cells. (A–G) NK cells and Daudi-rituximab were resuspended in Matrigel at E:T = 1:3 ± TAPI-0. Cell interactions were recorded every 3 min for 8 h. (A and B) Representative time-lapse–enlarged regions showing a composite of fluorescence and brightfield images. NK cells (blue), Daudi-rituximab (green), and dead cells (red) are shown at times indicated. Bars, 20 µm. (A) An NK cell (blue) formed a conjugate with a target (green; 0 min; yellow arrow). The NK cell formed a contact with another target (9 min; white arrow). The second target cell was killed (99 min), whereas the first one remained intact. The NK cell detached from both targets and moved to new target cells (132 min). (B) In the presence of TAPI-0, an NK cell established contact with a target cell (51 min; yellow arrow) and killed it (165 min). The NK cell remained attached to dead target until the end of acquisition (480 min). (C) Percentage of interactions that resulted in target cell lysis. (D) Percentage of NK cells that detached from target cells whether or not target cell was lysed. (E) Duration of all cytolytic NK cell–target cell contacts. Each point represents an individual contact. Yellow points indicate contacts still intact at the end of the acquisition (480 min). These points underestimate true contact times (median ± IQR). (F) Percentage of NK cells interacting with one, two, three, or more target cells. (G) Percentage of NK cells killing one or more target cells. Mean ± SD; symbols indicate different donors. n = 392 interactions from three independent experiments. *, P < 0.05; ***, P < 0.001 calculated by Student’s t test (C), one-way ANOVA (D), Mann-Whitney test (E), or two-way ANOVA (F and G).

Comment in

References

    1. Bhat R., and Watzl C.. 2007. Serial killing of tumor cells by human natural killer cells--enhancement by therapeutic antibodies. PLoS One. 2:e326 10.1371/journal.pone.0000326 - DOI - PMC - PubMed
    1. Bi J., and Tian Z.. 2017. NK Cell Exhaustion. Front. Immunol. 8:760 10.3389/fimmu.2017.00760 - DOI - PMC - PubMed
    1. Carisey A.F., Mace E.M., Saeed M.B., Davis D.M., and Orange J.S.. 2018. Nanoscale Dynamism of Actin Enables Secretory Function in Cytolytic Cells. Curr. Biol. 28:489–502. - PMC - PubMed
    1. Cartwright A.N., Griggs J., and Davis D.M.. 2014. The immune synapse clears and excludes molecules above a size threshold. Nat. Commun. 5:5479 10.1038/ncomms6479 - DOI - PMC - PubMed
    1. Cerboni C., Ardolino M., Santoni A., and Zingoni A.. 2009. Detuning CD8+ T lymphocytes by down-regulation of the activating receptor NKG2D: role of NKG2D ligands released by activated T cells. Blood. 113:2955–2964. 10.1182/blood-2008-06-165944 - DOI - PubMed

Publication types

MeSH terms