. 2018 Jul 2;9(1):2554.
doi: 10.1038/s41467-018-04973-4.

Early Palaeozoic ocean anoxia and global warming driven by the evolution of shallow burrowing

Affiliations

Early Palaeozoic ocean anoxia and global warming driven by the evolution of shallow burrowing

Sebastiaan van de Velde et al. Nat Commun. .

Abstract

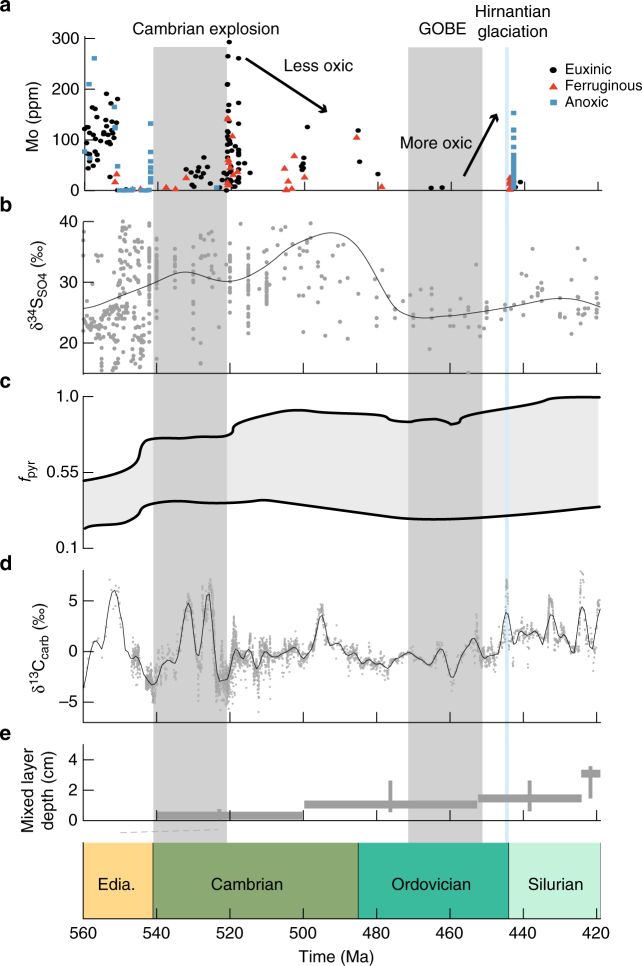
The evolution of burrowing animals forms a defining event in the history of the Earth. It has been hypothesised that the expansion of seafloor burrowing during the Palaeozoic altered the biogeochemistry of the oceans and atmosphere. However, whilst potential impacts of bioturbation on the individual phosphorus, oxygen and sulphur cycles have been considered, combined effects have not been investigated, leading to major uncertainty over the timing and magnitude of the Earth system response to the evolution of bioturbation. Here we integrate the evolution of bioturbation into the COPSE model of global biogeochemical cycling, and compare quantitative model predictions to multiple geochemical proxies. Our results suggest that the advent of shallow burrowing in the early Cambrian contributed to a global low-oxygen state, which prevailed for ~100 million years. This impact of bioturbation on global biogeochemistry likely affected animal evolution through expanded ocean anoxia, high atmospheric CO2 levels and global warming.


Conflict of interest statement

The authors declare no competing interests.

Figures

Fig. 1
Fig. 1
Compilation of geochemical data from the Neoproterozoic into the Palaeozic. a Mo abundances, as compiled by ref. . Higher oxygen levels lead to higher abundances of Mo. Note that other proxies providing support for the ocean oxygenation state outlined here are compiled in Supplementary Fig. 1. b Sulphate-S isotopes (δ34SSO4) as compiled by ref. . δ34SSO4 increases through the Cambrian, with a return to lighter values at the GOBE. c Pyrite fraction of sulphur burial (fpyr = pyrite burial/(pyrite burial + gypsum burial)), full range of estimates, as presented in ref. . d Carbonate-C isotopes (δ13Ccarb) as compiled by ref. . Higher values indicate a higher rate of organic carbon burial. e Mixed layer depth, reproduced from ref. . Black lines on panels b and d are local regression (LOESS) fits. Grey shaded areas indicate the Cambrian explosion (540–521 Ma) and the Great Ordovician Biodiversification Event (GOBE; 470–450 Ma). Blue shaded line indicates the Hirnantian glaciation
Fig. 2
Fig. 2
Diagram of key processes in the COPSE model. a Carbon cycle. Hydrospheric CO2 is transferred to sediments as organic C or carbonate by burial (B). Sedimentary C is returned to the ocean/atmosphere via weathering and metamorphism (W). Buried organic C is isotopically lighter than the carbon it is derived from. Burial of reduced organic carbon results in a net source of O2, whereas oxidative weathering of sedimentary organic carbon consumes O2. b Sulphur cycle. Burial of reduced pyrite is a net source of O2, whereas oxidative weathering of sedimentary pyrite consumes O2. c Oceanic phosphorus (P) cycle. Dissolved, bio-available P is delivered to the ocean by chemical weathering via rivers, and is buried either as organic phosphorus, or with iron or calcium minerals. Dashed lines show burial processes that are influenced by bioturbation (but are not considered so in the baseline model)
Fig. 3
Fig. 3
COPSE baseline model simulation. Simulation as presented in ref. . a Atmospheric CO2. b Average δ34SSO4 of seawater. c Pyrite fraction of sulphur burial. d Average δ13Ccarb of seawater. e Degree of ocean anoxia (1 = completely anoxic, 0 = completely oxic). f Summary of the evolution of sedimentary Mo concentrations over time. Model outcomes (in blue) are compared to δ13Ccarb and δ13SSO4 data and the sedimentary Mo concentrations, which is reflective of the extent of ocean oxygenation and is supported by multiple independent proxies (see Supplementary Note 1). Dotted lines in panels b and d represents a local regression (LOESS) fit to the data. Grey shaded areas indicate the Cambrian explosion (540–521 Ma) and the Great Ordovician Biodiversification Event (GOBE; 470–450 Ma). Blue shaded line indicates the Hirnantian glaciation
Fig. 4
Fig. 4
The effect of bioturbation on sediment geochemistry. a The effect of bioturbation intensity (Db) on the sulphur cycling rate. Model results reproduced from ref. . b Solid line (Scenario 1): the bioturbation impact on geochemistry (fbiot) is linearly correlated with the depth and intensity of burrowing. Dashed line (Scenario 2): the bioturbation impact is maximal with shallow burrowing, but the areal expansion of bioturbation increases gradually throughout the early Palaeozoic. Dash-dotted line (Scenario 3): the bioturbation impact on geochemistry (fbiot) is already at full strength by the end of the Cambrian explosion. c Simplified conceptual model of the effect of bioturbation on the sedimentary cycles of carbon, phosphorus and sulphur. Arrow sizes denote relative changes in flux sizes
Fig. 5
Fig. 5
COPSE model with the addition of the evolution of bioturbation. Scenario 1 shows the effect of the sedimentary response that scales linearly with bioturbation intensity. Scenarios 2 and 3 assume that the effects of bioturbation on sediment geochemistry occur non-linearly (strong response for low levels of bioturbation), where Scenario 2 follows a gradual increase of the areal extent of bioturbation and Scenario 3 shows the maximum effect at the Ediacaran-Cambrian boundary (see panels g, n, u). a, h, o Atmospheric CO2. b, i, p Average sulphate δ34S of seawater. c, j, q Pyrite fraction of sulphur burial. d, k, r Average δ13C of carbonate. e, l, s Degree of ocean anoxia. Model outcomes (in red) are fitted to the δ13Ccarb and δ13SSO4 proxies (grey dotted line represents a LOESS fit), predictions for the relative importance of pyrite for the total sulphur burial rate (blue dotted lines represent the range of model results presented in ref. ) and compared to a summary of the evolution of sedimentary Mo concentrations over time (f, m, t). Solid lines represent the model outcomes with anoxia feedback, dashed lines represent the model outcomes without anoxia feedback. Grey shaded areas indicate the Cambrian explosion (540–521 Ma) and the Great Ordovician Biodiversification Event (GOBE; 470–450 Ma). Blue shaded line indicates the Hirnantian glaciation

References

    1. Aller, R. C. The Influence of Macrobenthos on Chemical Diagenesis of Marine Sediments (Yale University, New Haven, CT, USA, 1977).
    1. Meysman FJR, Middelburg JJ, Heip CHR. Bioturbation: a fresh look at Darwin’s last idea. Trends Ecol. Evol. 2006;21:688–695. doi: 10.1016/j.tree.2006.08.002. - DOI - PubMed
    1. McIlroy D, Logan Ga. The impact of bioturbation on infaunal ecology and evolution during the Proterozoic-Cambrian transition. Palaios. 1999;14:58–72. doi: 10.2307/3515361. - DOI
    1. Kristensen E, et al. What is bioturbation? the need for a precise definition for fauna in aquatic sciences. Mar. Ecol. Prog. Ser. 2012;446:285–302. doi: 10.3354/meps09506. - DOI
    1. Herringshaw LG, Callow RHT, McIlroy D. Engineering the Cambrian explosion: the earliest bioturbators as ecosystem engineers. Geol. Soc. Lond. Spec. Publ. 2017;448:369–382. doi: 10.1144/SP448.18. - DOI

Publication types

LinkOut - more resources