. 2018 Jul 2;9(1):2557.
doi: 10.1038/s41467-018-04679-7.

Osteocytic oxygen sensing controls bone mass through epigenetic regulation of sclerostin

Affiliations

Osteocytic oxygen sensing controls bone mass through epigenetic regulation of sclerostin

Steve Stegen et al. Nat Commun. .

Abstract

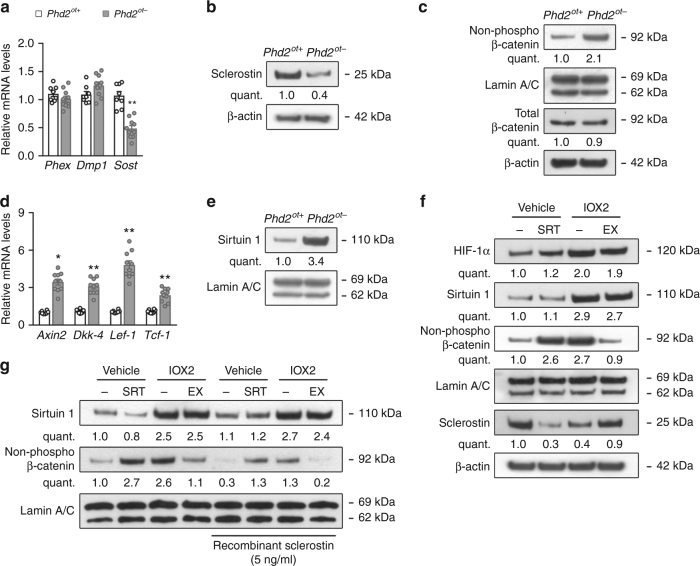
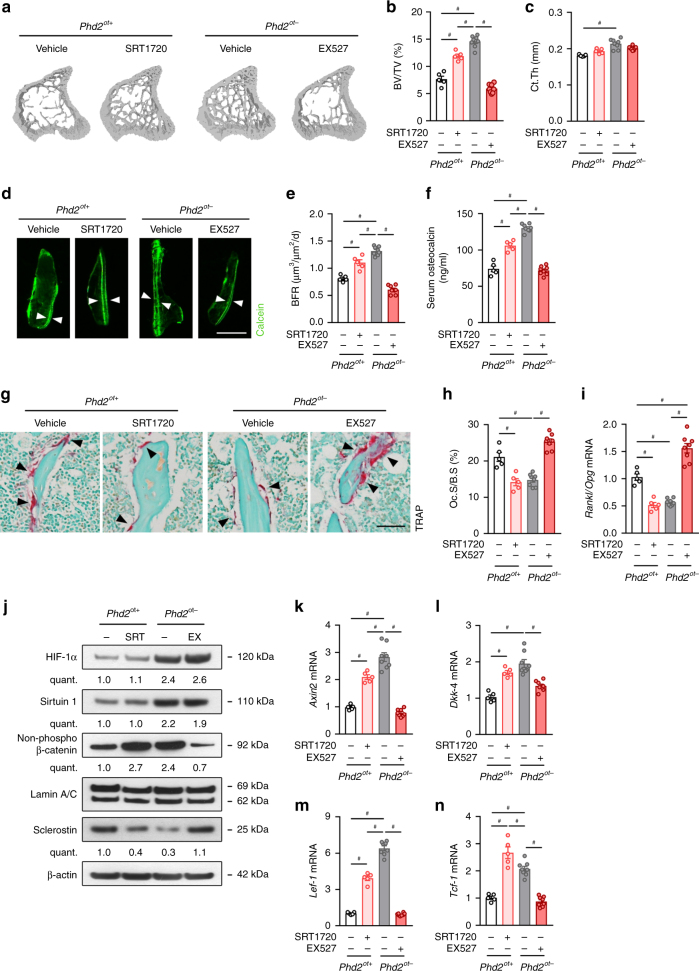
Preservation of bone mass is crucial for healthy ageing and largely depends on adequate responses of matrix-embedded osteocytes. These cells control bone formation and resorption concurrently by secreting the WNT/β-catenin antagonist sclerostin (SOST). Osteocytes reside within a low oxygen microenvironment, but whether and how oxygen sensing regulates their function remains elusive. Here, we show that conditional deletion of the oxygen sensor prolyl hydroxylase (PHD) 2 in osteocytes results in a high bone mass phenotype, which is caused by increased bone formation and decreased resorption. Mechanistically, enhanced HIF-1α signalling increases Sirtuin 1-dependent deacetylation of the Sost promoter, resulting in decreased sclerostin expression and enhanced WNT/β-catenin signalling. Additionally, genetic ablation of PHD2 in osteocytes blunts osteoporotic bone loss induced by oestrogen deficiency or mechanical unloading. Thus, oxygen sensing by PHD2 in osteocytes negatively regulates bone mass through epigenetic regulation of sclerostin and targeting PHD2 elicits an osteo-anabolic response in osteoporotic models.


Conflict of interest statement

The authors declare no competing interests.

Figures

Fig. 1
Fig. 1
Deletion of PHD2 in osteocytes increases bone mass. a PHD2 and β-actin immunoblot on whole-cell extracts isolated from osteocyte-enriched bone fractions of 8-week-old mice. Results are representative of three experiments. b HIF-1α, HIF-2α and Lamin A/C immunoblot on nuclear cell extracts isolated from osteocyte-enriched bone fractions. Results are representative of three experiments. c, d 3D microCT models (c) of the tibial metaphysis and quantification (d) of trabecular bone volume (BV/TV) and cortical thickness (Ct.Th) in 8-week-old mice (n = 8 Phd2ot+–10 Phd2ot−). e, f Von Kossa staining (e) of tibiae with quantification (f) of trabecular bone volume (BV/TV) (n = 8 Phd2ot+–10 Phd2ot−). Scale bar is 500 µm. Data are means ± SEM. *p < 0.05 vs. Phd2ot+, **p < 0.01 vs. Phd2ot+ (Student′s t-test)
Fig. 2
Fig. 2
Bone formation exceeds bone resorption in Phd2ot− mice. a, b H&E staining (a) of the tibial metaphysis with quantification (b) of osteoblast number per bone surface (N.Ob/B.S) and osteoblast surface per bone surface (Ob.S/B.S) in 8-week-old mice (n = 8 Phd2ot+–10 Phd2ot−). White arrowheads in a indicate osteoblasts. c, d H&E staining (c) of the cortical diaphysis of tibiae with quantification (d) of osteocyte number per bone area (N.Ot/B.Ar) and percentage of empty osteocyte lacunae (n = 8 Phd2ot+–10 Phd2ot). e, f Calcein labelling of mineralizing surfaces on trabeculae (e) with quantification (f) of the bone formation rate (BFR) and mineral apposition rate (MAR) (n = 8 Phd2ot+–10 Phd2ot−). White arrowheads in e indicate calcein incorporation. g Serum osteocalcin levels (n = 8 Phd2ot+–10 Phd2ot−). h, i TRAP staining (h) of the tibial metaphysis with quantification (i) of osteoclast surface per bone surface (Oc.S/B.S) (n = 8 Phd2ot+–10 Phd2ot−). Black arrowheads in h indicate osteoclasts. j Serum CTx-I levels (n = 8 Phd2ot+ –10 Phd2ot-). Data are means ± SEM. *p < 0.05 vs. Phd2ot+, **p < 0.01 vs. Phd2ot+, N.S. is not significant (Student′s t-test). Scale bars in a, e and h are 50 µm, scale bar in c is 100 µm
Fig. 3
Fig. 3
PHD2 deletion reduces sclerostin expression through SIRT1. a Phex, Dmp1 and Sost mRNA levels in osteocyte-enriched bone fractions of 8-week-old mice (n = 8 Phd2ot+–10 Phd2ot−). b Sclerostin and β-actin immunoblot on whole-cell extracts isolated from osteocyte-enriched bone fractions. c Non-phosphorylated (non-phospho) β-catenin and Lamin A/C immunoblot (nuclear cell extracts), and total β-catenin and β-actin immunoblot (whole-cell extracts). Protein extracts are isolated from osteocyte-enriched bone fractions. d Axin2, Dkk-4, Lef-1 and Tcf-1 mRNA levels in osteocyte-enriched bone fractions (n = 8 Phd2ot+– 10 Phd2ot). e Sirtuin 1 and Lamin A/C immunoblot on nuclear cell extracts isolated from osteocyte-enriched bone fractions. f Sirtuin 1, non-phospho β-catenin, Lamin A/C, sclerostin and β-actin immunoblot isolated from vehicle (IDGVEH) or IOX2-treated IDG-SW3 (IDGIOX2) cells after 14 days of osteogenic differentiation. IDGVEH cells were treated with vehicle (−) or SRT1720 (SRT); IDGIOX2 cells were treated with vehicle (−) or EX527 (EX). g Sirtuin 1, non-phospho β-catenin and Lamin A/C immunoblot on nuclear cell extracts isolated from IDGVEH or IDGIOX2 cells after 14 days of osteogenic differentiation in the presence of recombinant sclerostin. Cells were treated as in f. Data are means ± SEM. Immunoblot images are representative of three experiments. *p < 0.05 vs. Phd2ot+, **p < 0.01 vs. Phd2ot+ (Student′s t-test)
Fig. 4
Fig. 4
Decreased sclerostin affects osteoblasts and osteoclasts. a Alizarin Red staining of IDGVEH or IDGIOX2 cells after 14 or 21 days of osteogenic differentiation (n = 3). IDGVEH cells were treated with vehicle (−) or SRT1720 (SRT); IDGIOX2 cells were treated with vehicle (−) or EX527 (EX). b Alizarin Red staining of IDGVEH or IDGIOX2 cells after 14 days of osteogenic differentiation in the presence of recombinant sclerostin (n = 3). Cells were treated as in a. c Rankl and Opg mRNA levels in osteocyte-enriched bone fractions of 8-week-old mice (n = 8 Phd2ot+–10 Phd2ot-). d RANKL, OPG and β-actin immunoblot on whole-cell extracts isolated from osteocyte-enriched bone fractions. e RANKL, OPG and β-actin immunoblot on whole-cell extracts isolated from IDGVEH or IDGIOX2 cells after 14 days of osteogenic differentiation. Cells were treated as in a. f Quantification of TRAP-positive multinuclear cells (MNC), formed after co-culturing wild-type hematopoietic cells with IDG-SW3 cells, in which Phd2 was deleted or not via CRISPR-Cas9 (n = 3). g Rankl/Opg mRNA ratio in IDGVEH or IDGIOX2 cells after 14 days of osteogenic differentiation in the presence of recombinant sclerostin (n = 3). Cells were treated as in a. Data are means ± SEM. Immunoblot images are representative of three experiments. *p < 0.05 vs. Phd2ot+ (Student′s t-test), #p < 0.05 (two-way ANOVA)
Fig. 5
Fig. 5
SIRT1 regulates bone mass in Phd2ot− mice. ac 3D microCT models of the tibial metaphysis (a) and quantification of trabecular bone volume (BV/TV; b) and cortical thickness (Ct.Th; c) in 8-week-old mice (n = 5 Phd2ot+–8 Phd2ot−). Mice were treated with vehicle, SRT1720 or EX527 for 5 weeks. d, e Calcein labelling of trabecular mineralizing surfaces (d) with quantification (e) of the bone formation rate (BFR) (n = 5 Phd2ot+–8 Phd2ot−). White arrowheads in d indicate calcein incorporation. f Serum osteocalcin levels (n = 5 Phd2ot+–8 Phd2ot−). g, h TRAP staining (g) of the tibial metaphysis with quantification (h) of the osteoclast surface per bone surface (Oc.S/B.S) (n = 5 Phd2ot+–8 Phd2ot−). Black arrowheads in g indicate osteoclasts. i Rankl/Opg mRNA levels in osteocyte-enriched bone fractions (n = 5 Phd2ot+–8 Phd2ot−). j HIF-1α, Sirtuin 1, non-phosphorylated (non-phospho) β-catenin, Lamin A/C (nuclear cell extracts), and sclerostin and β-actin immunoblot (whole-cell extracts). Protein extracts are isolated from osteocyte-enriched bone fractions. Results are representative of three experiments. kn Axin2 (k), Dkk-4 (l), Lef-1 (m) and Tcf-1 (n) mRNA levels in osteocyte-enriched bone fractions (n = 5 Phd2ot+–8 Phd2ot−). Data are means ± SEM. #p < 0.05 (two-way ANOVA). Scale bars in a and g are 50 µm
Fig. 6
Fig. 6
HIF-1α controls SIRT1 expression. a HIF-1α, HIF-2α and Lamin A/C immunoblot on nuclear cell extracts derived from IDGVEH or IDGIOX2 cells after transduction with scrambled shRNA (shScr), shHIF-1α (shH1) or shHIF-2α (shH2). Results are representative of three experiments. b Sirtuin 1, non-phosphorylated (non-phospho) β-catenin, Lamin A/C (nuclear cell extracts), and sclerostin and β-actin immunoblot (whole-cell extracts). Protein extracts are derived from IDGVEH or IDGIOX2 cells after genetic silencing of HIF-1α (shH1) or HIF-2α (shH2). Results are representative of three experiments. cf Axin2 (c), Dkk-4 (d), Lef-1 (e), Tcf-1 (f) mRNA levels in IDGVEH or IDGIOX2 cells after genetic silencing of HIF-1α (shH1) or HIF-2α (shH2) (n = 3). Data are means ± SEM. #p < 0.05 (one-way ANOVA)
Fig. 7
Fig. 7
Deletion of PHD2 in osteocytes stimulates angiogenesis. a, b CD31 immunostaining (a) of the tibial metaphysis with quantification (b) of blood vessel number and size in 8-week-old mice (n = 8 Phd2ot+–10 Phd2ot). c, d CD31 immunostaining (c) of the cortical diaphysis of tibiae with quantification (d) of blood vessel number and size (n = 8 Phd2ot+–10 Phd2ot−). e Vegf and Plgf mRNA levels in femora of 8-week-old mice (n = 8 Phd2ot+–10 Phd2ot−) and in vehicle (IDGVEH) or IOX2-treated IDG-SW3 (IDGIOX2) cells (n = 3). f Scheme of experimental design. HIF-1α (shH1) or HIF-2α (shH2) were silenced in IDGIOX2 cells and a scrambled shRNA (shScr) was used as control. Conditioned medium was subsequently used to culture HUVECs in monoculture or in co-culture with IDG-SW3 cells. g Proliferation of HUVECs in monoculture according to the scheme in f (n = 3). h, i Human CD31 (hCD31) immunostaining (h) and quantification (i) of hCD31-positive surface in HUVECs co-cultured with IDG-SW3 cells, according to the scheme in f. When indicated, cells were treated with anti-VEGF164 antibody or recombinant mouse soluble VEGFR-1 (sFlt) (n = 3). Data are means ± SEM. *p < 0.05 vs. Phd2ot+ or IDGVEH, **p < 0.01 vs. Phd2ot+ or IDGVEH, ***p < 0.01 vs. Phd2ot+ or IDGVEH (Student′s t-test), #p < 0.05 (ANOVA: one-way ANOVA in g; two-way ANOVA in i). Scale bars in a and c are 100 µm, scale bar in h is 500 µm
Fig. 8
Fig. 8
Phd2ot− mice are protected from disuse-induced bone loss. ac 3D microCT models of the tibial metaphysis (a) and quantification of trabecular bone volume (BV/TV) (b) and cortical thickness (Ct.Th) (c) 4 weeks after hindlimb unloading and expressed as a percentage relative to grounded mice (n = 7 Phd2ot+–8 Phd2ot). d, e Calcein labelling of trabecular mineralizing surfaces (d) with quantification (e) of the bone formation rate (BFR) (n = 7 Phd2ot+–8 Phd2ot−). White arrowheads in d indicate calcein incorporation. f Serum osteocalcin levels (n = 7 Phd2ot+–8 Phd2ot−). g, h TRAP staining (g) of the tibial metaphysis with quantification (h) of the osteoclast surface per bone surface (Oc.S/B.S) (n = 7 Phd2ot+–8 Phd2ot−). Black arrowheads in g indicate osteoclasts. i Rankl/Opg mRNA levels in osteocyte-enriched bone fractions (n = 7 Phd2ot+–8 Phd2ot−). j HIF-1α, Sirtuin 1, non-phosphorylated (non-phospho) β-catenin, Lamin A/C (nuclear cell extracts), and sclerostin and β-actin immunoblot (whole-cell extracts). Protein extracts are isolated from osteocyte-enriched bone fractions. Results are representative of four experiments. HU is hindlimb unloading. kn Axin2 (k), Dkk-4 (l), Lef-1 (m) and Tcf-1 (n) mRNA levels in osteocyte-enriched bone fractions (n = 7 Phd2ot+–8 Phd2ot−). Data are means ± SEM. #p < 0.05 (two-way ANOVA). Scale bars in d and g are 50 µm
Fig. 9
Fig. 9
Phd2ot− mice are protected from OVX-induced bone loss. ac 3D microCT models of the tibial metaphysis (a) and quantification of trabecular bone volume (BV/TV) (b) and cortical thickness (Ct.Th) (c) 4 weeks after OVX and expressed as a percentage relative to sham-operated mice (n = 7 Phd2ot+–8 Phd2ot−). d, e TRAP staining (d) of the tibial metaphysis with quantification (e) of the osteoclast surface per bone surface (Oc.S/B.S) (n = 7 Phd2ot+–8 Phd2ot−). Black arrowheads in e indicate osteoclasts. f Rankl/Opg mRNA levels in osteocyte-enriched bone fractions (n = 7 Phd2ot+–8 Phd2ot−). g, h Calcein labelling of trabecular mineralizing surfaces (g) with quantification (h) of the bone formation rate (BFR) (n = 7 Phd2ot+–8 Phd2ot−). White arrowheads in g indicate calcein incorporation. i Serum osteocalcin levels (n = 7 Phd2ot+–8 Phd2ot−). j HIF-1α, Sirtuin 1, non-phosphorylated (non-phospho) β-catenin, Lamin A/C (nuclear cell extracts) and sclerostin and β-actin immunoblot (whole-cell extracts). Protein extracts are derived from osteocyte-enriched bone fractions. Results are representative of four experiments. kn Axin2 (k), Dkk-4 (l), Lef-1 (m) and Tcf-1 (n) mRNA levels in osteocyte-enriched bone fractions (n = 7 Phd2ot+–8 Phd2ot−). Data are means ± SEM. #p < 0.05 (two-way ANOVA). Scale bars in d and g are 50 µm

Similar articles

Cited by

References

    1. Sims NA, Martin TJ. Coupling the activities of bone formation and resorption: a multitude of signals within the basic multicellular unit. Bone. Rep. 2014;3:481. - PMC - PubMed
    1. Nakashima T, et al. Evidence for osteocyte regulation of bone homeostasis through RANKL expression. Nat. Med. 2011;17:1231–1234. doi: 10.1038/nm.2452. - DOI - PubMed
    1. Xiong J, et al. Matrix-embedded cells control osteoclast formation. Nat. Med. 2011;17:1235–1241. doi: 10.1038/nm.2448. - DOI - PMC - PubMed
    1. Bonewald LF. The amazing osteocyte. J. Bone Miner. Res. 2011;26:229–238. doi: 10.1002/jbmr.320. - DOI - PMC - PubMed
    1. Dallas SL, Prideaux M, Bonewald LF. The osteocyte: an endocrine cell… and more. Endocr. Rev. 2013;34:658–690. doi: 10.1210/er.2012-1026. - DOI - PMC - PubMed

Publication types

MeSH terms