. 2018 Jul 2;8(1):9967.
doi: 10.1038/s41598-018-28270-8.

A Cosine Similarity Algorithm Method for Fast and Accurate Monitoring of Dynamic Droplet Generation Processes

Affiliations

A Cosine Similarity Algorithm Method for Fast and Accurate Monitoring of Dynamic Droplet Generation Processes

Xiurui Zhu et al. Sci Rep. .

Abstract

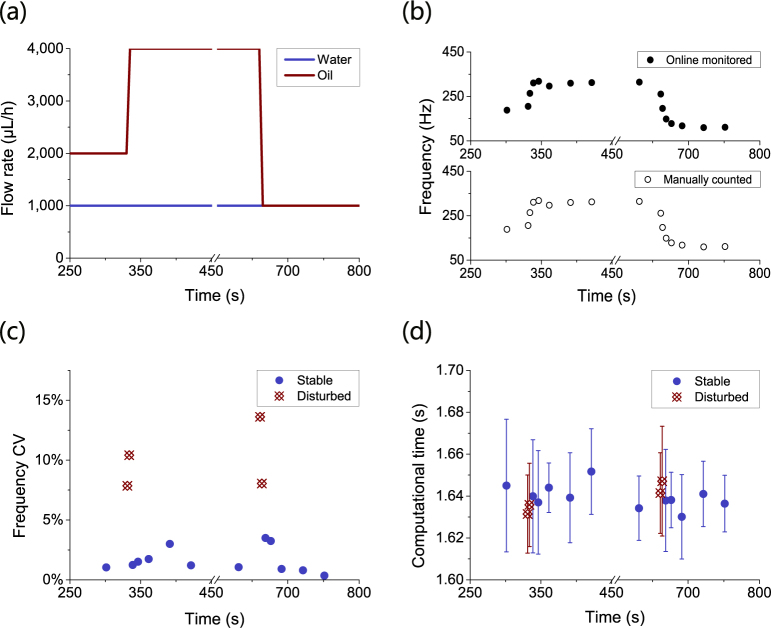
Droplet microfluidics has attracted significant interests in functional microcapsule synthesis, pharmaceuticals, fine chemicals, cosmetics and biomedical research. The low variability of performing chemical reactions inside droplets could benefit from improved homogeneity and reproducibility. Therefore, accurate and convenient methods are needed to monitor dynamic droplet generation processes. Here, a novel Cosine Similarity Algorithm (CSA) method was developed to monitor the droplet generation frequency accurately and rapidly. With a microscopic droplet generation video clip captured with a high-speed camera, droplet generation frequency can be computed accurately by calculating the cosine similarities between the frames in the video clip. Four kinds of dynamic droplet generation processes were investigated including (1) a stable condition in a single microfluidic channel, (2) a stable condition in multiple microfluidic channels, (3) a single microfluidic channel with artificial disturbances, and (4) microgel fabrication with or without artificial disturbances. For a video clip with 5,000 frames and a spatial resolution of 512 × 62 pixels, droplet generation frequency up to 4,707.9 Hz can be calculated in less than 1.70 s with an absolute relative calculation error less than 0.08%. Artificial disturbances in droplet generation processes can be precisely determined using the CSA method. This highly effective CSA method could be a powerful tool for further promoting the research of droplet microfluidics.


Conflict of interest statement

The authors declare no competing interests.

Figures

Figure 1
Figure 1
Schematic diagram of the cosine similarity algorithm (CSA) method for the calculation of droplet generation frequency’s mean value and coefficient of variation (CV). (a) Droplets are generated with a microfluidic chip, and a microscopic video clip is captured by a high-speed camera. (b) A reference frame is designated as shown in the box with red dashed border. (c) Similarity vector is calculated consisting of the cosine similarities between each frame (including the reference frame) and the reference frame. The oscillation of the similarity vector is correlated with the generation of droplets. (d) The cyclic auto-spectrum reveals the oscillation frequency of the vector, and the fundamental frequency peak at frequency f* = 1,200.0Hz is converted to droplet generation frequency’s mean value f¯ and CV CVf (see supplementary methods in the supplementary information for further details about the equations).
Figure 2
Figure 2
The concept of cosine similarity and its calculation. (a) A reference frame and four frames from a video clip. The frames (with indices 1, 2, 3 and 4) have a spatial resolution of 2 × 1 pixels. Frame 1 is designated as the reference frame (with index r). (b) The grayscale vectors h(1), h(2), h(3), h(4), and their corresponding included angles θ1, θ2, θ3, θ4 with the grayscale vector h(r) are illustrated. (c) The cosine similarities are calculated as the cosine of the included angles. (d) Four frames (with indices n1, n2, n3 and n4 in ascending order) and a reference frame (with index r = 1; n1) from a droplet generation video clip. (e) The cosine similarities are calculated between each frame from the video clip and the reference frame, indicating that frame n4 was identical to the reference frame.
Figure 3
Figure 3
Two configurations of flow rates: fixed oil/water flow rate ratio and fixed oil and water flow rates, were investigated for droplet generation processes in a stable condition in single microfluidic channels. The droplet was generated (a) in three different modes: squeezing, dripping and jetting, and (b) at different frequencies ranging from 67.3 Hz to 4,707.9 Hz. The labels in the x-axes correspond to different combinations of oil and water flow rates shown at the bottom of the figure.
Figure 4
Figure 4
With the CSA method, fast and accurate calculation of droplet generation frequency’s mean value and CV can be obtained for droplet generation processes in a stable condition in single microfluidic channels. (a) The average computation time of CSA was 1.63 s. (b) The absolute relative calculation error was less than 0.08%. (c) Droplet generation frequency’s CV indicated the size uniformity of droplets in the three different modes, and droplets generated in dripping mode had the highest size uniformity with an average CV of 0.35%. The labels in the x-axes correspond to different combinations of oil and water flow rates were shown at the bottom of Fig. 3.
Figure 5
Figure 5
With the CSA method, fast and accurate calculation of droplet generation frequency’s mean value and CV can be obtained for droplet generation processes in a stable condition in multiple microfluidic channels. For droplet generation processes in a stable condition in multiple channels, (a) three droplet generation processes in a stable condition in single microfluidic channels were analyzed with CSA as non-overlapping droplet generation frequencies and two droplet generation processes in a stable condition in multiple microfluidic channels were reconstructed. The CSA method calculated all the non-overlapping droplet generation frequencies in the two reconstructed video clips in single runs. The positions of frequency peaks in the two reconstructed video clips were consistent with those in the three corresponding droplet generation processes in single channels. (b) The average computation time of CSA increased from 0.36 s to 3.11 s with the increase in spatial resolution of the video clips. (c) The absolute relative calculation error of the droplet generation processes in a stable state in single channels was less than 0.21%, and that of the droplet generation processes in a stable state in multiple channels was less than 0.56%.
Figure 6
Figure 6
The time periods affected by artificial disturbances can be detected and located with the CSA method in a droplet generation process. For a droplet generation process with artificial disturbances in a single channel, (a) the artificial disturbances were introduced by toggling oil flow rate from 2,000 μL/h to 4,000 μL/h and finally to 1,000 μL/h during the course of the droplet generation process. (b) The droplet generation frequency’s mean value was closely monitored online with CSA. (c) Droplet generation frequency’s CV increased from 1.63% to 9.98% on average when the disturbances occurred. (d) The average computation time was 1.64 s, which was not affected by the disturbances.
Figure 7
Figure 7
The size uniformity of pre-microgel droplets can be characterized and monitored with the CSA method in pre-microgel droplet generation processes with or without disturbances. For a pre-microgel droplet generation process, (a) two configurations of oil and gel solution flow rates were investigated: one without disturbances and the other with intentional interruptions of oil and water phase injection as artificial disturbances. (b) Although droplet diameter’s mean value was not affected by the disturbances to a large extent, droplet diameter’s CV (calculated from microscopic images) increased from 2.77% to 6.59% on average due to the disturbances. The scale bars in the microscopic images are 50 μm. (c) Droplet generation frequency was closely monitored with CSA in both configurations. The size uniformity of the pre-microgel droplets was characterized by two different parameters: droplet generation frequency’s CV and droplet diameter’s CV. In the configuration without disturbances, both parameters indicated no disturbances. In the configuration with artificial disturbances, however, droplet generation frequency’s CV indicated that artificial disturbances had happened twice during the process, while droplet diameter’s CV indicated only once.
Figure 8
Figure 8
Droplet generating and monitoring platform. Droplets were generated with a conventional droplet generation platform consisting of two syringe pumps, a microscope, a drop-maker microfluidic chip, a high-speed camera, a personal computer, syringes, and tubings.

References

    1. Wang JT, Wang J, Han JJ. Fabrication of advanced particles and particle-based materials assisted by droplet-based microfluidics. Small. 2011;7:1728–1754. doi: 10.1002/smll.201001913. - DOI - PubMed
    1. Günther A, Jensen KF. Multiphase microfluidics: from flow characteristics to chemical and materials synthesis. Lab Chip. 2006;6:1487–1503. doi: 10.1039/B609851G. - DOI - PubMed
    1. Rossow T, et al. Controlled synthesis of cell-laden microgels by radical-free gelation in droplet microfluidics. J Am Chem Soc. 2012;134:4983–4989. doi: 10.1021/ja300460p. - DOI - PubMed
    1. Priest C, Herminghaus S, Seemann R. Generation of monodisperse gel emulsions in a microfluidic device. Appl Phys Lett. 2006;88:024106. doi: 10.1063/1.2164393. - DOI
    1. Choi C-H, et al. Generation of monodisperse alginate microbeads and in situ encapsulation of cell in microfluidic device. Biomed Microdevices. 2007;9:855–862. doi: 10.1007/s10544-007-9098-7. - DOI - PubMed

Publication types