. 2018 Jul 2;8(1):9963.
doi: 10.1038/s41598-018-28089-3.

Different concentrations of lipopolysaccharide regulate barrier function through the PI3K/Akt signalling pathway in human pulmonary microvascular endothelial cells

Affiliations

Different concentrations of lipopolysaccharide regulate barrier function through the PI3K/Akt signalling pathway in human pulmonary microvascular endothelial cells

Xia Zheng et al. Sci Rep. .

Abstract

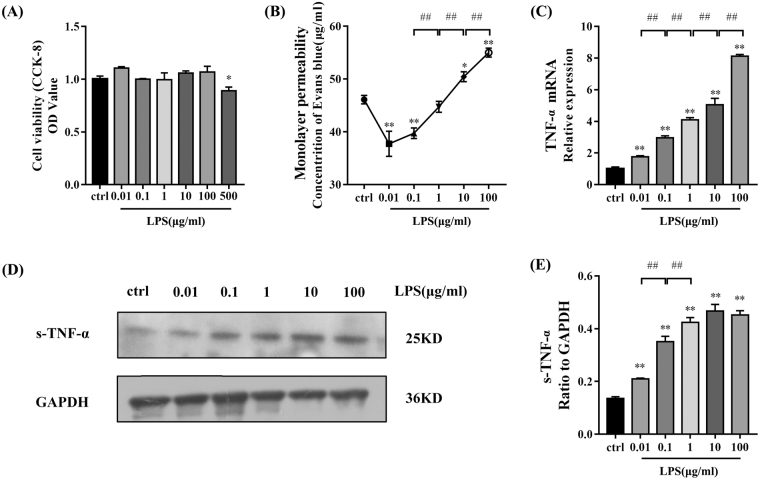
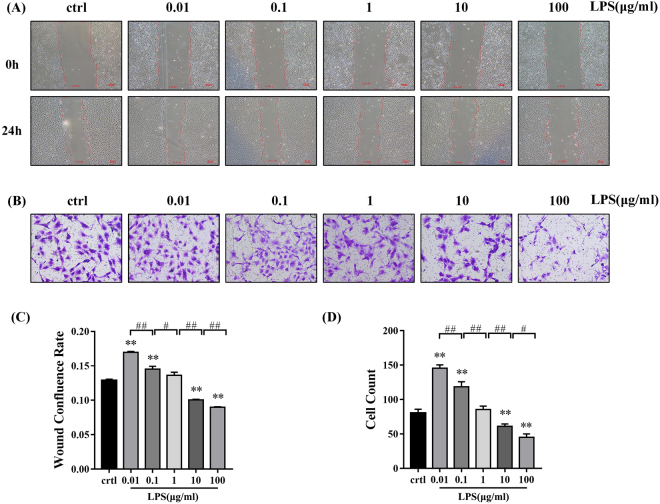
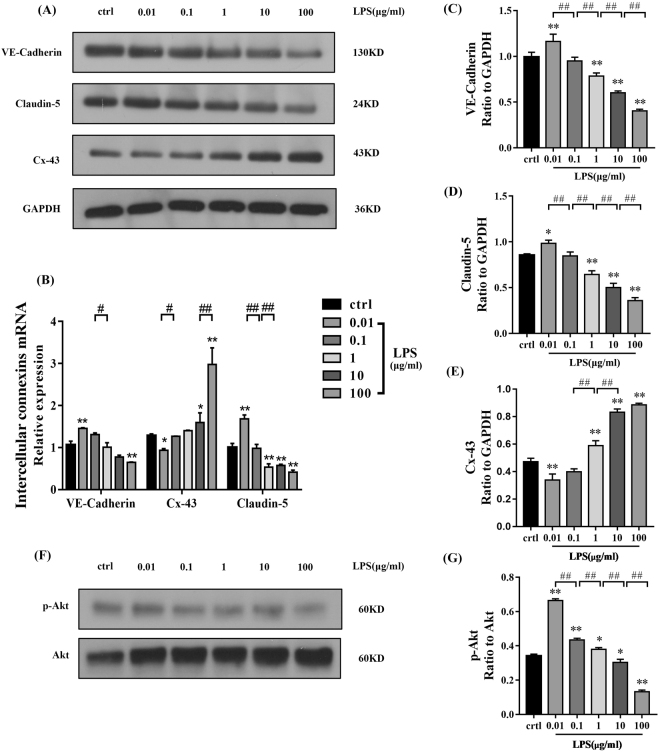
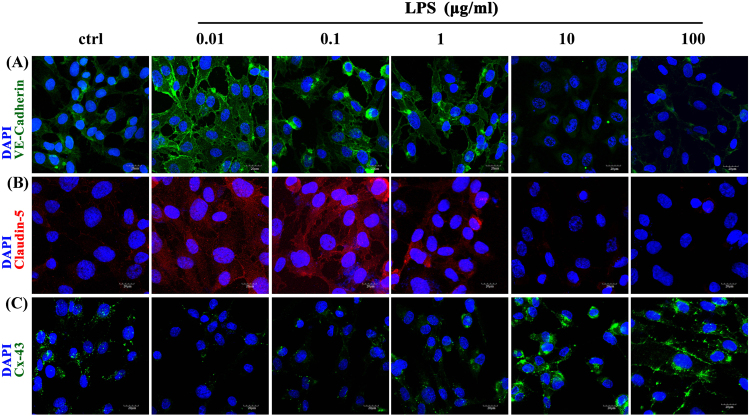
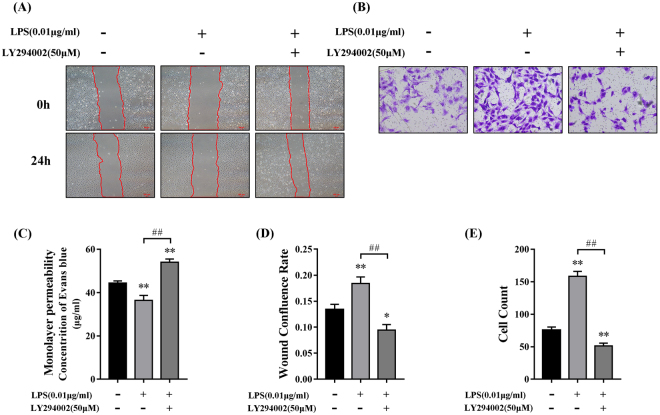
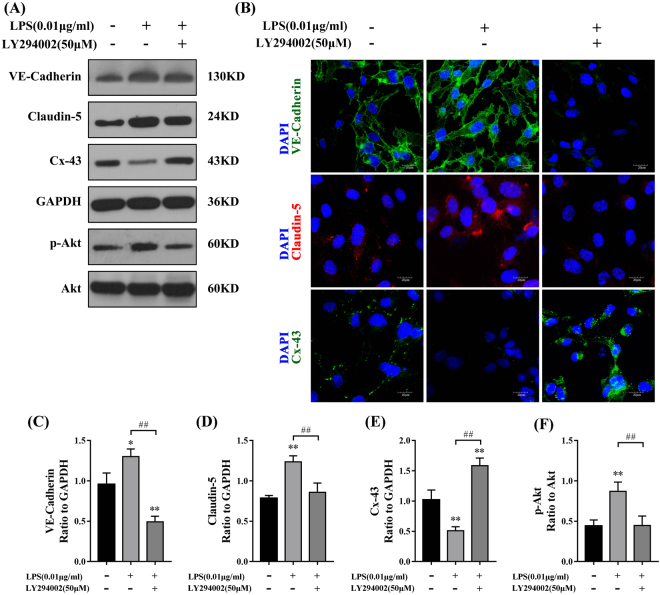
Lipopolysaccharide (LPS) can lead to vascular endothelial barrier dysfunction, which often results in acute lung injury and acute respiratory distress syndrome. However, the effects of different concentrations of LPS on human pulmonary microvascular endothelial barrier function and the involvement of the phosphatidylinositol-3-kinase-serine/threonine kinase (PI3K/Akt) pathway in this process remain unclear. Human pulmonary microvascular endothelial cells (HPMECs) were stimulated with different doses of LPS, and barrier function was examined by determining cell monolayer permeability, cell migration, and the expression of intercellular junction proteins (VE-Cadherin, Claudin-5, and Connexin-43). LY294002 was used to inhibit PI3K to verify the role of the PI3K/Akt pathway in the regulation of barrier function in HPMECs stimulated by LPS. Low doses of LPS increased HPMEC migration, up-regulated VE-Cadherin and Claudin-5 expression, down-regulated Connexin-43 expression, and promoted Akt phosphorylation, which could collectively decrease monolayer permeability. In contrast, high doses of LPS suppressed HPMEC migration, down-regulated the expression of VE-Cadherin and Claudin-5, up-regulated Connexin-43 expression, and reduced Akt phosphorylation, which could collectively increase monolayer permeability. LPS has a biphasic effect on HPMEC barrier function through the PI3K/Akt pathway, and this effect is concentration-dependent.


Conflict of interest statement

The authors declare no competing interests.

Figures

Figure 1
Figure 1
Changes in cell proliferation, monolayer permeability, and tumour necrosis factor-α (TNF-α) in HPMECs treated with different concentrations of LPS. (A) Proliferation was measured using a CCK-8 kit. There was no significant difference between each group except for the 500 μg/ml LPS group (P < 0.05). (B) Monolayer permeability was measured using a Transwell-Evans Blue (EB) assay. EB concentrations in the lower chambers were decreased in groups treated with 0.01 μg/ml (P < 0.01) and 0.1 μg/ml LPS (P < 0.01) and higher in groups treated with 10 μg/ml (P < 0.05) and 100 μg/ml (P < 0.01) LPS than in the control group. (C) Transcript levels of TNF-α in HPMECs treated with different concentrations of LPS. mRNA expression of TNF-α was upregulated with increasing LPS concentration compared with that in the control group (P < 0.01). (D,E) TNF-α protein concentration in the supernatant increased with increased LPS concentration compared with that in the control group (P < 0.01). Error bars represent SD (standard deviation), *P < 0.05 vs. control group, **P < 0.01 vs. control group, #P < 0.05, ##P < 0.01.
Figure 2
Figure 2
Migration of HPMECs treated with different concentrations of LPS. (A,C) The effects of LPS on scratch wound confluence in cultured HPMECs. (A) Representative images (C) Quantification of confluence rate at 24 h [% wound confluence = (a − b) × 100%/a; a = Initial scratch wound area at 0 h, b = Scratch wound area at 24 h]. Compared with that in the control group, cell confluence was significantly increased in the 0.01 (P < 0.01) and 0.1 μg/ml LPS (P < 0.01) groups and significantly decreased in the 10 (P < 0.01) and 100 μg/ml LPS (P < 0.01) groups. (B,D) A Transwell assay was used to measure migration. (B) Representative images. (D) Quantification of cell migration after 24 h. Cell numbers in the 0.01 (P < 0.01) and 0.1 μg/ml LPS groups (P < 0.01) were significantly higher and those in the 10 μg/ml (P < 0.01) and 100 μg/ml (P < 0.01) LPS groups were lower than in the control group.
Figure 3
Figure 3
The effects of LPS on the expression of intercellular junctions and Akt phosphorylation in HPMECs. (A) Expression of intercellular junction proteins (VE-Cadherin, Cx-43, and Claudin-5) was evaluated by western blot. Relative protein levels are expressed as the ratio of the target protein to GAPDH. (C,D) The levels of VE-Cadherin and Claudin-5 were remarkably up-regulated after treatment with 0.01 μg/ml LPS (C: P < 0.01, D: P < 0.05) and down-regulated after treatment with 1 (P < 0.01), 10 (P < 0.01), and 100 μg/ml LPS (P < 0.01) compared with those in the control group. (E) Cx-43 levels were decreased after 0.01 µg/ml LPS treatment (P < 0.01) and up-regulated after 1 (P < 0.01), 10 (P < 0.01), and 100 μg/ml LPS (P < 0.01) treatment compared with those in the control. (B) VE-Cadherin and Claudin-5 mRNA transcript levels were up-regulated after 0.01 μg/ml LPS treatment (P < 0.01), but down-regulated after 100 μg/ml LPS (P < 0.01) treatment compared with those in the control group. Claudin-5 mRNA levels were also decreased after 1 (P < 0.01) and 10 μg/ml (P < 0.01) LPS treatment. Cx-43 mRNA levels were decreased in the 0.01 μg/ml LPS group (P < 0.05), but were increased in the 10 (P < 0.05) and 100 μg/ml LPS groups (P < 0.01) compared with those in the control. (F,G) The ratio of p-Akt to total Akt protein was increased in the 0.01 (P < 0.01), 0.1 (P < 0.01), and 1 μg/ml (P < 0.05) LPS groups, and was decreased in the 10 (P < 0.05) and 100 μg/ml (P < 0.01) LPS groups compared with that in the control group.
Figure 4
Figure 4
Immunofluorescence staining of VE-Cadherin, Claudin-5, and Cx-43 in HPMECs treated with 0.01, 0.1, 1, 10 and 100 μg/ml LPS. (A) The expression of VE-Cadherin after LPS treatment. Green represents VE-Cadherin and blue represents the nuclei. (B) The expression of Claudin-5 after treatment with different concentrations of LPS. Red indicates Claudin-5 and blue indicates nuclei. (C) The expression of Cx-43 after treatment with different concentrations of LPS. Green indicates Cx-43 and blue indicates nuclei. Scale bar: 20 μm
Figure 5
Figure 5
Monolayer permeability and migration of HPMECs after PI3K/Akt inhibition. (A,D) Wound healing assay (A) Representative images (D) Relative migration levels are presented as the scratch wound confluence rate after 24 h. The change of confluence rate in the LPS (0.01 μg/ml) group was significantly higher than in the control (P < 0.01) and LPS + LY294002 groups (P < 0.01). (B,E) Cell Transwell assay (B) Representative images (E) The number of migrated cells in the LPS (0.01 μg/ml) group was significantly higher than in the control (P < 0.01) and LPS + LY294002 groups (P < 0.01). (C) Monolayer permeability was measured by Transwell-EB assay; EB concentration in the LPS (0.01 μg/ml) group was lower than in the control (P < 0.01) and LPS + LY294002 groups (P < 0.01). There were no significant differences between the control group and LY294002 group (P > 0.05) in monolayer permeability, wound confluence rate and cell count (see Supplementary Fig. 1).
Figure 6
Figure 6
The expression of intercellular junction proteins after PI3K/Akt inhibition. (A) The expression of VE-Cadherin, Claudin-5, and Cx-43 was measured by Western blot analysis. (C,D) Relative protein levels are shown as the ratio of the target protein to GAPDH. The expression of VE-Cadherin and Claudin-5 in the LPS (0.01 μg/ml) group was increased compared with that in the control (C: P < 0.05, D: P < 0.01) and LPS + LY294002 groups (P < 0.01). (E) The expression of Cx-43 in the LPS (0.01 μg/ml) group was decreased compared with that in the control (P < 0.01) and LPS + LY294002 groups (P < 0.01). (B) Immunofluorescence staining of VE-Cadherin, Claudin-5, and Cx-43 in HPMECs treated with 0.01 μg/ml LPS and 50 μM LY294002. Green indicates VE-Cadherin and Cx-43, while red indicates Claudin-5 and blue indicates nuclei. (A,F) The ratio of p-Akt to total Akt in the LPS (0.01 μg/ml) group was higher than in the control (P < 0.01) and LPS + LY294002 groups (P < 0.01). Scale bar: 20 μm.

Similar articles

Cited by

References

    1. Seymour CW, et al. Assessment of Clinical Criteria for Sepsis: For the Third International Consensus Definitions for Sepsis and Septic Shock (Sepsis-3) Jama. 2016;315:762–774. doi: 10.1001/jama.2016.0288. - DOI - PMC - PubMed
    1. Lagu T, et al. Hospitalizations, costs, and outcomes of severe sepsis in the United States 2003 to 2007. Critical care medicine. 2012;40:754–761. doi: 10.1097/CCM.0b013e318232db65. - DOI - PubMed
    1. Bellani G, et al. Epidemiology, Patterns of Care, and Mortality for Patients With Acute Respiratory Distress Syndrome in Intensive Care Units in 50 Countries. Jama. 2016;315:788–800. doi: 10.1001/jama.2016.0291. - DOI - PubMed
    1. Liu H, Yu X, Yu S, Kou J. Molecular mechanisms in lipopolysaccharide-induced pulmonary endothelial barrier dysfunction. Int Immunopharmacol. 2015;29:937–946. doi: 10.1016/j.intimp.2015.10.010. - DOI - PubMed
    1. Force ADT, et al. Acute respiratory distress syndrome: the Berlin Definition. Jama. 2012;307:2526–2533. - PubMed

Publication types

MeSH terms

LinkOut - more resources