. 2018 Jul 2;9(1):2566.
doi: 10.1038/s41467-018-04968-1.

Immediate action is the best strategy when facing uncertain climate change

Affiliations

Immediate action is the best strategy when facing uncertain climate change

Maria Abou Chakra et al. Nat Commun. .

Abstract

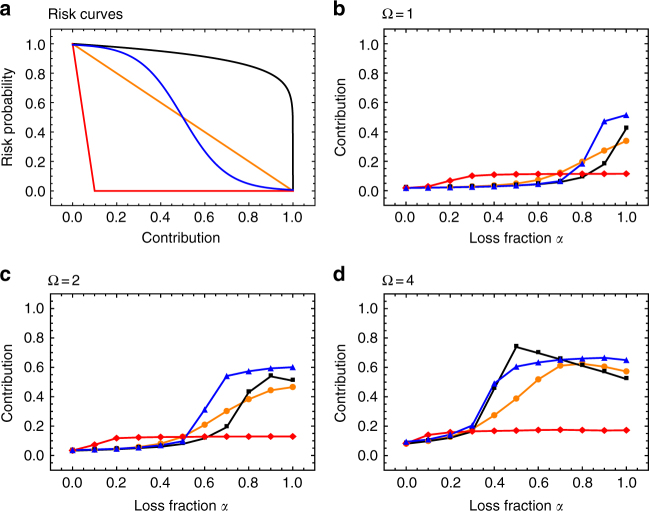
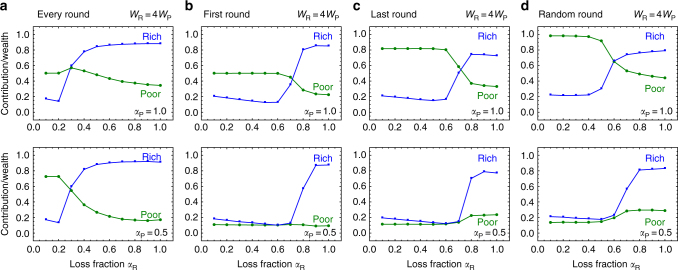
Mitigating the detrimental effects of climate change is a collective problem that requires global cooperation. However, achieving cooperation is difficult since benefits are obtained in the future. The so-called collective-risk game, devised to capture dangerous climate change, showed that catastrophic economic losses promote cooperation when individuals know the timing of a single climatic event. In reality, the impact and timing of climate change is not certain; moreover, recurrent events are possible. Thus, we devise a game where the risk of a collective loss can recur across multiple rounds. We find that wait and see behavior is successful only if players know when they need to contribute to avoid danger and if contributions can eliminate the risks. In all other cases, act quickly is more successful, especially under uncertainty and the possibility of repeated losses. Furthermore, we incorporate influential factors such as wealth inequality and heterogeneity in risks. Even under inequality individuals should contribute early, as long as contributions have the potential to decrease risk. Most importantly, we find that catastrophic scenarios are not necessary to induce such immediate collective action.


Conflict of interest statement

The authors declare no competing interests.

Figures

Fig. 1
Fig. 1
Risk curves and the effect of the fraction lost on contributions. a Four different risk curves are explored: linear (orange), piece-wise linear (red), a power function (black), and curves exhibiting threshold effects (blue). In the remaining panels, the average contributions for different values of the fraction lost, α, are shown. b In the collective-risk game with one round (Ω = 1) exclusively large values of α elicit contributions. c In the game played over two rounds contributions tend to rise in α. d Multiple potential losses induce a clear rise in contributions (games are between two individuals, m = 2, evolutionary dynamics with a population size N = 100 and averages over 105 generations, 1000 games per generation, mutation probability μ = 0.03, and the standard deviation for mutations in the individual thresholds determining contributions τr is set to σ = 0.15 (Methods section). The functional forms of the curves are given in the Methods section)
Fig. 2
Fig. 2
Contributions for different timings of potential losses in a game with up to four rounds. In a game with Ω rounds, for four different risk curves, we show the average contributions of two players (large panels) and the resulting risk probability (small panels) with a potential loss in a every round, b the first round, c the last round, or d a random round. It is assumed that individuals lose everything, i.e., α = 1 for all individuals. a Multiple losses in the four-round game lead to increased contributions, in particular in the first round. b If the risk is only present in the first round, no further contributions emerge, as expected. c if the risk is only present in the last round,,, we recover the wait and see behavior if there is a strong threshold effects, see also Methods. d The scenario where a single event can hit in a random round is qualitatively similar to the last round scenario (games are pair-wise, population size N = 100, 1000 games per generation, mutation rate μ = 0.03, and the standard deviation for mutations in the individual decision thresholds τr is set to σ = 0.15)
Fig. 3
Fig. 3
Variation of lost endowment for rich and poor player. We plot the average contribution from rich and poor players across various αR for the rich player in a four-round game where risk is in a every round, b the first round, c the last or d a random round. Simulations show when poor players lose everything, αP = 1 or half of their wealth αP = 0.5 (games are pair-wise, pCr=1+expλCrW0-12-1 with λ3 = 10, W0 = WR + WP, population size N = 100, 1000 games per generation, mutation rate μ = 0.03, and the standard deviation σ for mutations of the individual decision thresholds τr is set to 0.15)
Fig. 4
Fig. 4
Contributions for different timings of potential losses in a four-round game. The graphs depict average contributions in each round of a four-round game with a potential loss in a every round, b the first round, c the last, or d a random round (games are pair-wise, p=1+expλ3CrW0-12-1, λ3 = 10, initial wealth of both players W0 = WR,0 + WP,0 = 4 + 1 = 5, population size N = 100, 1000 games per generation, mutation rate μ = 0.03, and the standard deviation for mutations in the individual decision thresholds τr is set to σ = 0.15)
Fig. 5
Fig. 5
Exploring the shape of risk curves. Average contributions for various risk curves and fractions of lost wealth α (see color code) are shown. In case the risk hits, each player, i, will lose αiWi,r for each loss event. The shape of the curve is regulated by parameter λ on the x-axis. a In the case of linear risk curves and Ω = 1, contributions are largest at intermediate values of λ (contributions are small if the curve has a steep slope). b Similar effects on contributions apply to the power function risk curve. c The step-like risk curve with lower initial risk for smaller values of λ3 shows that contributions are rising in α (games are between two individuals, initial wealth of both players W0 = 2, population size N = 100, averages over 105 generations, 1000 games per generation, mutation rate μ = 0.03, and the standard deviation for mutations in the thresholds τr is set to σ = 0.15), see ref. for a similar simulation

References

    1. Schmidt RC. A balanced-efforts approach for climate cooperation. Nat. Clim. Change. 2015;50:10–12. doi: 10.1038/nclimate2447. - DOI
    1. Ordner JP. Community action and climate change. Nat. Clim. Change. 2017;70:161–163. doi: 10.1038/nclimate3236. - DOI
    1. Gordon HS. The economic theory of a common-property resource: the fishery. J. Polit. Econ. 1954;62:124–142. doi: 10.1086/257497. - DOI
    1. Hardin G. The tragedy of the commons. Science. 1968;162:1243–1248. doi: 10.1126/science.162.3859.1243. - DOI - PubMed
    1. Hardin R. Collective action as an agreeable n-prisoners’ dilemma. Behav. Sci. 1971;160:472–481. doi: 10.1002/bs.3830160507. - DOI

LinkOut - more resources