. 2018 Jul 2;9(1):2560.
doi: 10.1038/s41467-018-04994-z.

TGF-β signaling alters H4K20me3 status via miR-29 and contributes to cellular senescence and cardiac aging

Affiliations

TGF-β signaling alters H4K20me3 status via miR-29 and contributes to cellular senescence and cardiac aging

Guoliang Lyu et al. Nat Commun. .

Abstract

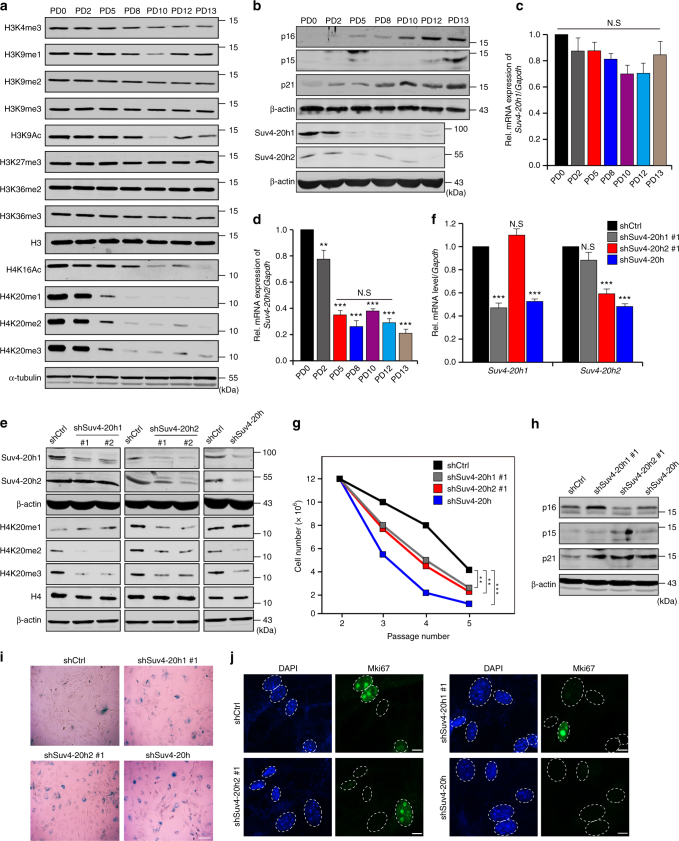
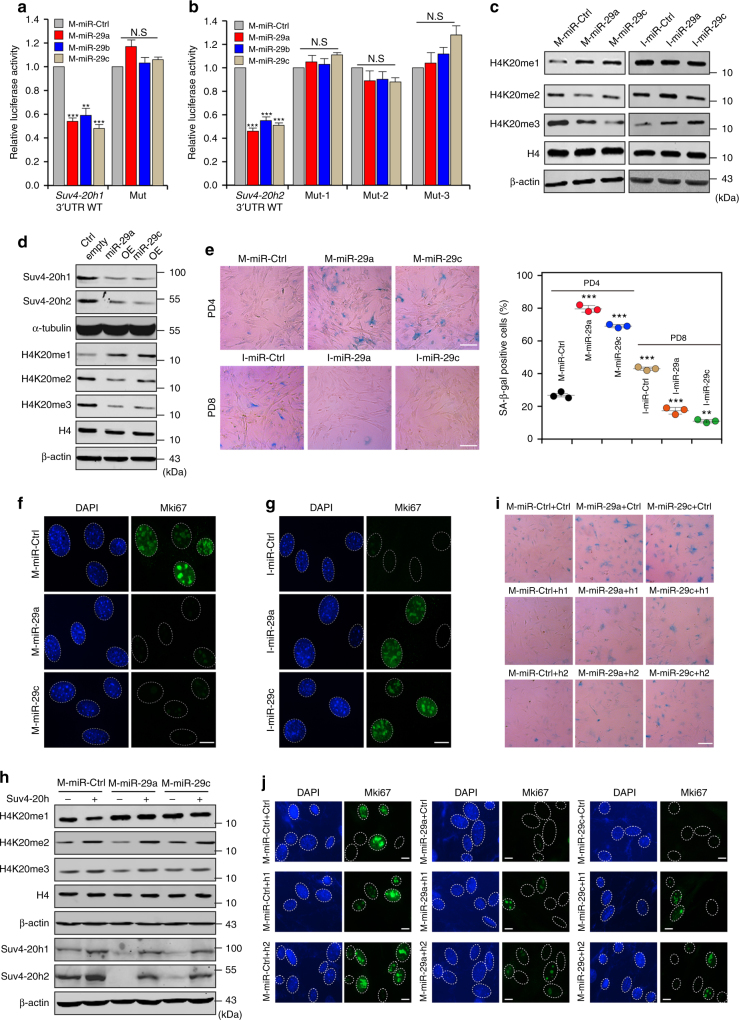
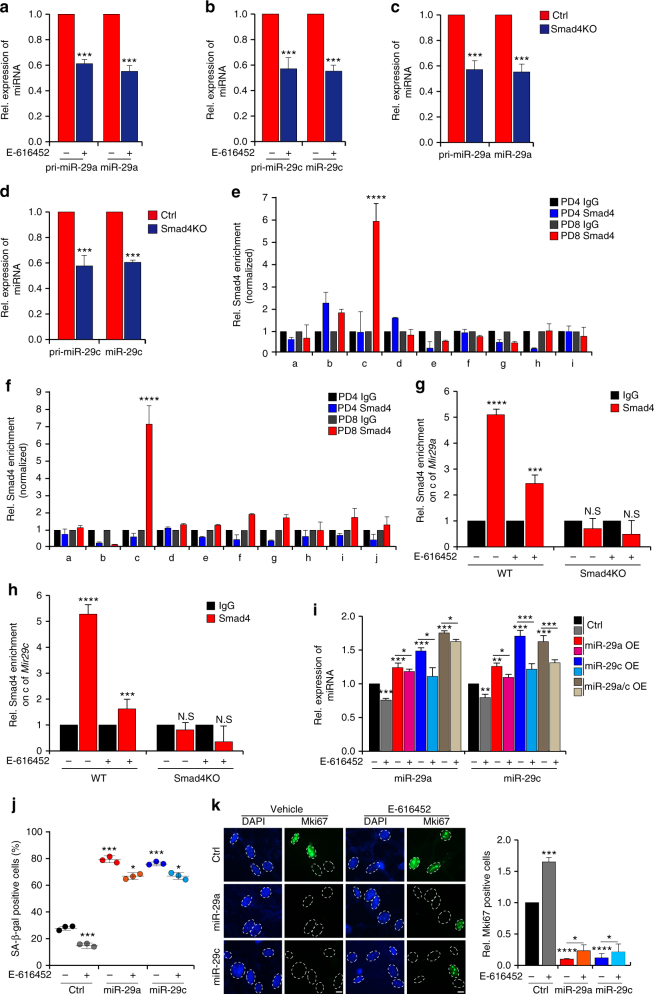
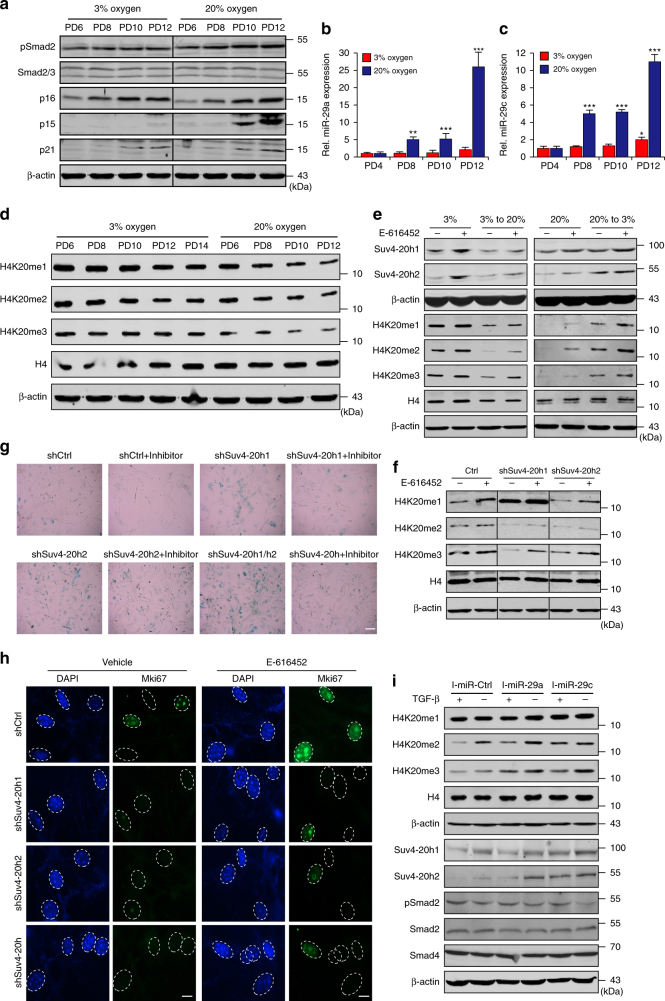
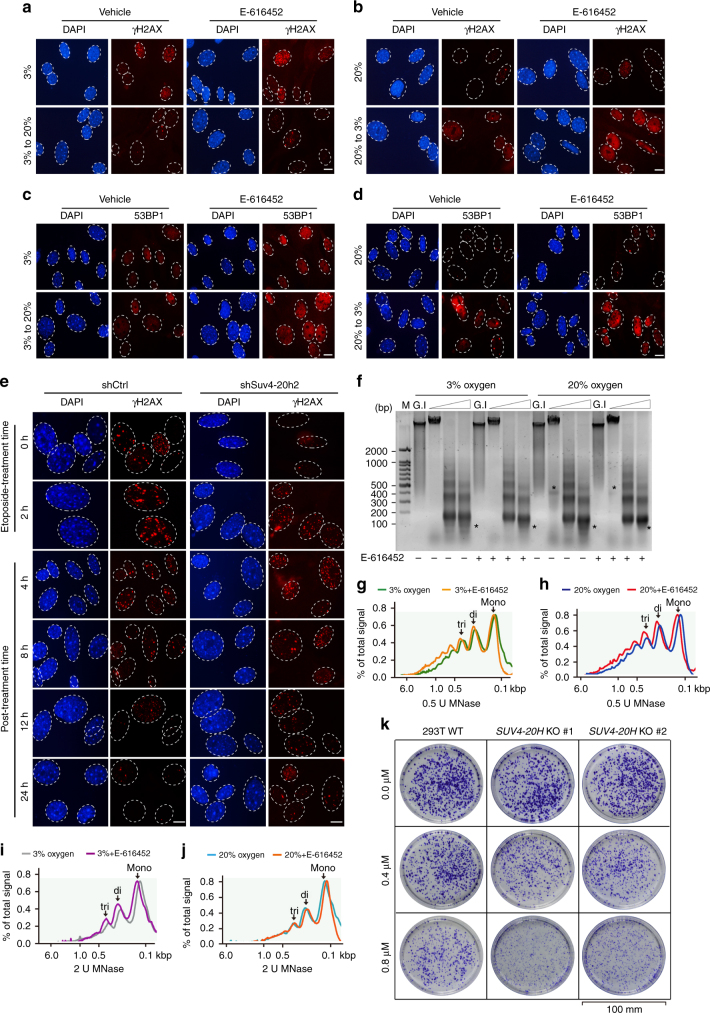
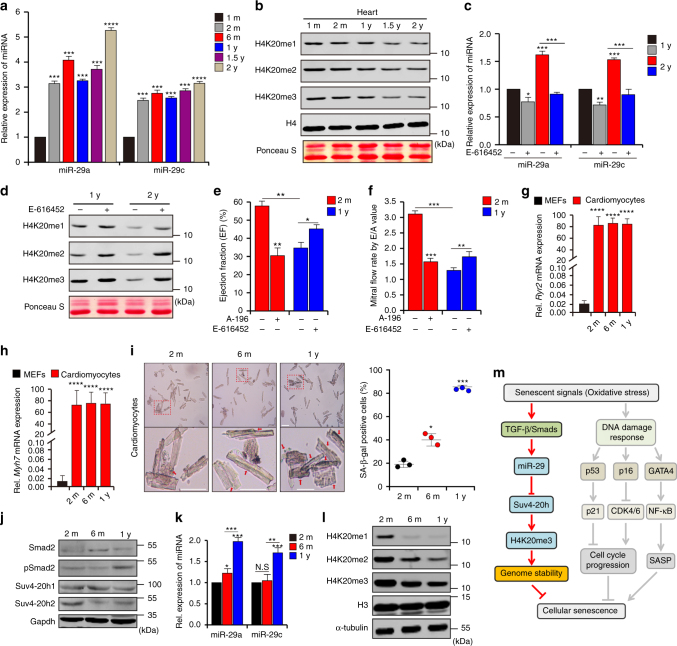
Cellular senescence is a well-orchestrated programmed process involved in age-related pathologies, tumor suppression and embryonic development. TGF-β/Smad is one of the predominant pathways that regulate damage-induced and developmentally programmed senescence. Here we show that canonical TGF-β signaling promotes senescence via miR-29-induced loss of H4K20me3. Mechanistically, oxidative stress triggers TGF-β signaling. Activated TGF-β signaling gives rise to acute accumulation of miR-29a and miR-29c, both of which directly suppress their novel target, Suv4-20h, thus reducing H4K20me3 abundance in a Smad-dependent manner, which compromises DNA damage repair and genome maintenance. Loss of H4K20me3 mediated by the senescent TGF-β/miR-29 pathway contributes to cardiac aging in vivo. Disruption of TGF-β signaling restores H4K20me3 and improves cardiac function in aged mice. Our study highlights the sequential mechanisms underlying the regulation of senescence, from senescence-inducing triggers to activation of responsive signaling followed by specific epigenetic alterations, shedding light on potential therapeutic interventions in cardiac aging.


Conflict of interest statement

The authors declare no competing interests.

Figures

Fig. 1
Fig. 1
Loss of H4K20me3 promotes cellular senescence. a Western blot for total protein of the indicated histone modifications from serially passaged MEFs. H3, H4 and α-tubulin served as loading controls. b Western blots showing expression of p16, p15, p21, Suv4-20h1 and Suv4-20h2 during MEFs senescence. β-actin served as a loading control. c, d Real-time qPCR analysis of Suv4-20h1 (c) and Suv4-20h2 (d) mRNA expression in different passages of MEFs. e, f Western blot (e) and RT-qPCR (f) for Suv4-20h in knockdown cells. g Growth curve of Suv4-20h-depleted cells. h Expression of p16, p15 and p21 in Suv4-20h knockdown cells. β-actin served as a loading control. i SA-β-gal staining in control (Ctrl) and Suv4-20h (shSuv4-20h) knockdown cells. Scale bar, 20 μm. j Immunofluorescent staining of Mki67 in control (Ctrl) and Suv4-20h depleted cells. Scale bar, 5 μm. Two-tailed unpaired Student t-tests were performed, **p < 0.01, ***p < 0.001
Fig. 2
Fig. 2
miR-29-mediated reduction of H4K20me3 leads to premature cellular senescence. a, b Luciferase assays with the wild-type Suv4-20h1 3′ UTR or mutated Suv4-20h1 3′ UTR (a), as well as with the wild-type Suv4-20h2 3′ UTR or mutated Suv4-20h2 3′ UTR (b) in the predicted binding site of miR-29a, miR-29b and miR-29c, transfected with control miRNA mimics (M-miR-Ctrl) or miR-29 mimics (M-miR-29a, M-miR-29b and M-miR-29c). c Protein levels of H4K20 were measured by western blotting in MEFs transfected with M-miR-29 or miR-29 inhibitors (I-miR-29a and I-miR-29c). β-actin served as a loading control. d Western blot for global H4K20 methylation in cells with lentivirus-mediated ectopic expression of the indicated miR-29. β-actin served as a loading control. e SA-β-gal staining and diagrams showing MEFs from PD4 transfected with M-miR-29 and MEFs from PD8 transfected with I-miR-29. Scale bar, 20 μm. One-way ANOVA with Dunnett’s multiple comparison test was performed. f, g Immunofluorescent staining of Mki67 in MEFs transfected with M-miR-29 (f) or I-miR-29 (g). Scale bar, 5 μm. h Cells were first transfected with M-miR-Ctrl, M-miR-29a or M-miR-29c, after which they were infected with pBabe, pBabe-Suv4-20h1 or pBabe-Suv4-20h2 and subjected to western blotting for the indicated protein. β-actin served as a loading control. i SA-β-gal staining analysis was performed as described for cells in h. Scale bar, 20 μm. j Immunofluorescent staining of Mki67 in the cells from i. Scale bar, 5 μm. The error bars show the s.d obtained from triplicate independent experiments. Two-tailed unpaired Student’s t-tests were performed, **p < 0.01, ***p < 0.001
Fig. 3
Fig. 3
TGF-β signaling regulates miR-29 expression in a Smad-dependent manner during MEFs senescence. ad Quantitative real-time PCR for pri-miR-29 and miR-29 in MEFs incubated with E-616452 (a, b) or Smad4 knockout (Smad4KO) MEFs (c, d). e, f Chromatin immunoprecipitation-qPCR (ChIP-qPCR) assays of Smad4 from PD4 and PD8 MEFs. The x-axis represents the primer positons of the predicted promoters of Mir29a (e) and Mir29c (f). g, h Smad4 enrichment on Mir29a (g) and Mir29c (h) was measured in inhibitor-treated MEFs and Smad4KO MEFs. i MEFs with lentivirus-mediated expression of miR-29 were incubated with E-616452. Real-time PCR was used to measure miR-29 expression. j Diagrams showing SA-β-gal staining of MEFs collected from i. k Immunofluorescent staining showing the Mki67 signals in MEFs with the same treatment as those shown in i. Scale bar, 5 μm. The error bars represent the s.d obtained from triplicate independent experiments. Two-tailed unpaired Student’s t-tests were performed, **p < 0.01, ***p < 0.001
Fig. 4
Fig. 4
Regulation of senescence by TGF-β signaling is dependent on miR-29-induced inhibition of H4K20me3. a Western blot for the indicated proteins in MEFs grown in 3% oxygen or 20% oxygen. β-actin served as a loading control. b, c RT-qPCR analysis of miR-29 expression in the cells from a. d Western blot to assess total H4K20 methylation in serially passaged MEFs grown in 3% oxygen or 20% oxygen. β-actin served as a loading control. e MEFs grown in 3% oxygen and transferred to 20% oxygen (left) or MEFs grown in 20% oxygen and transferred to 3% oxygen (right) were treated with or without inhibitors. Protein changes were tested by western blot. H4 and β-actin served as loading controls. f Western blots showing altered H4K20 methylation in MEFs incubated with or without inhibitors upon knockdown of shCtrl, Suv4-20h1, Suv4-20h2 or both. g SA-β-gal staining showing alterations in the SA-β-gal signal in the cells from f. Scale bar, 20 μm. One-way ANOVA with Dunnett’s multiple comparison test analysis was performed. h Immunofluorescent staining showing the Mki67 signal in MEFs exposed to the same treatment as those shown in f. Scale bar, 5 μm. i Western blot for analyzing the indicated proteins in MEFs subjected to inhibition of miR-29 expression followed by TGF-β treatment. H4 and β-actin served as loading controls. The error bars represent the s.d. obtained from triplicate independent experiments. Two-tailed unpaired Student’s t-tests were performed, **p < 0.01, ***p < 0.001
Fig. 5
Fig. 5
H4K20me3 contributes to DNA damage repair and genome maintenance. ad MEFs cultured under the indicated conditions and treated with or without inhibitors were collected for immunofluorescent staining of γH2AX (a, b) or 53BP1 (c, d). Scale bar, 5 μm. e Etoposide-treated control (shCtrl) or Suv4-20h2 knockdown (shSuv4-20h2) cells were subjected to γH2AX staining according to the indicated time course. Scale bar, 5 μm. fj Nuclei from cells grown in 3% oxygen or 20% oxygen and treated with or without E-616452, were incubated with 0, 0.5 or 2 U of MNase for 5 min followed by DNA extraction, agarose gel electrophoresis and ethidium bromide staining. The asterisks indicate prominent fragment changes (f). The band densities were quantified using Image J software and illustrated as percentage of the signal subtracted background of the entire line from top to the bottom. Calibrated kilobase pair (kbp) sizes are indicated (gj). k Wild-type HEK293T (293T WT) and SUV4-20H knockout cells (SUV4-20H KO #1 and SUV4-20H KO #2) were treated with the indicated concentration of etoposide, followed by crystal violet staining. Scale bar, 100 mm
Fig. 6
Fig. 6
TGF-β/miR-29/H4K20me3 is involved in aging-associated cardiac dysfunction. a RT-qPCR to measure miR-29 expression, normalized to U6, in murine hearts (n = 4 per age) of the indicated ages (1-month-old, 1 m; 2-month-old, 2 m; 1-year-old, 1 y; 1.5-year-old, 1.5 y; 2-year-old, 2 y). b Western blot for H4K20 methylation in hearts of the indicated ages. c RT-qPCR to examine miR-29 expression in hearts of 1 y and 2 y mice, fed with DMSO or E-616452. The error bars represent the s.d obtained from triplicate independent experiments. d Western blot for H4K20 methylation in hearts from c. e, f Mice (2 m) fed with DMSO (n = 4) or A-196 (n = 4) and mice (1 y) treated with DMSO (n = 8) or E-616452 (n = 8) were subjected to cardiac function analysis using an echocardiographic imaging system (VisualSonics Vevo 2100, USA). EF (e) represents the ejection fraction of left ventricular flow, whereas E/A (f), the peak early filling (E-wave)/late diastolic filling (A-wave), represents the mitral flow rate. Representative images are shown in Supplementary Fig. 7e, f. The error bars represent the s.d. of the mean values. g, h RT-qPCR analysis of Ryr2 (g) and Myh7 (h) expression in cardiomyocytes isolated from mice of the indicated ages. i SA-β-gal staining of cardiomyocytes from mice as in g. The lower panel shows the magnified cells enclosed by red rectangular boxes in the images in the upper panel. Scale bar = 20 μm. The plot shows the proportion of SA-β-gal-stained cells among the different age groups. j Western blot for the indicated proteins in cells from i. k RT-qPCR for miR-29 expression in isolated cells from i. l Western blot for H4K20 methylations in cells from f. m Mechanisms proposed in this study. When cells undergo senescence-inducing stimuli, such as oxidative stress, TGF-β signaling is activated and serves as the signal transducer that promotes acute accumulation of miR-29, which in turn results in suppression of Suv4-20h and reduction in H4K20me3 abundance, leading to defective DNA damage repair and impaired maintenance of genome stability, and thus accelerating cellular senescence. Gapdh, H3 and α-tubulin were loading controls. Two-tailed unpaired Student’s t-tests, *p < 0.05, **p < 0.01, ***p < 0.001

References

    1. Dimri GP, et al. A biomarker that identifies senescent human cells in culture and in aging skin in vivo. Proc. Natl Acad. Sci. USA. 1995;92:9363–9367. doi: 10.1073/pnas.92.20.9363. - DOI - PMC - PubMed
    1. Coppé JP, et al. Senescence-associated secretory phenotypes reveal cell-nonautonomous functions of oncogenic RAS and the p53 tumor suppressor. PLoS Biol. 2008;6:e301. doi: 10.1371/journal.pbio.0060301. - DOI - PMC - PubMed
    1. Rodier F, Campisi J. Four faces of cellular senescence. J. Cell Biol. 2011;192:547–556. doi: 10.1083/jcb.201009094. - DOI - PMC - PubMed
    1. Burd CE, et al. Monitoring tumorigenesis and senescence in vivo with a p16(INK4a)-luciferase model. Cell. 2013;152:340–351. doi: 10.1016/j.cell.2012.12.010. - DOI - PMC - PubMed
    1. Serrano M, Lin AW, McCurrach ME, Beach D, Lowe SW. Oncogenic ras provokes premature cell senescence associated with accumulation of p53 and p16 INK4a. Cell. 1997;88:593–602. doi: 10.1016/S0092-8674(00)81902-9. - DOI - PubMed

Publication types

MeSH terms