. 2018 Jun 18:9:1381.
doi: 10.3389/fimmu.2018.01381. eCollection 2018.

CD4+ T Cell Fate Decisions Are Stochastic, Precede Cell Division, Depend on GITR Co-Stimulation, and Are Associated With Uropodium Development

Affiliations

CD4+ T Cell Fate Decisions Are Stochastic, Precede Cell Division, Depend on GITR Co-Stimulation, and Are Associated With Uropodium Development

Stephen P Cobbold et al. Front Immunol. .

Abstract

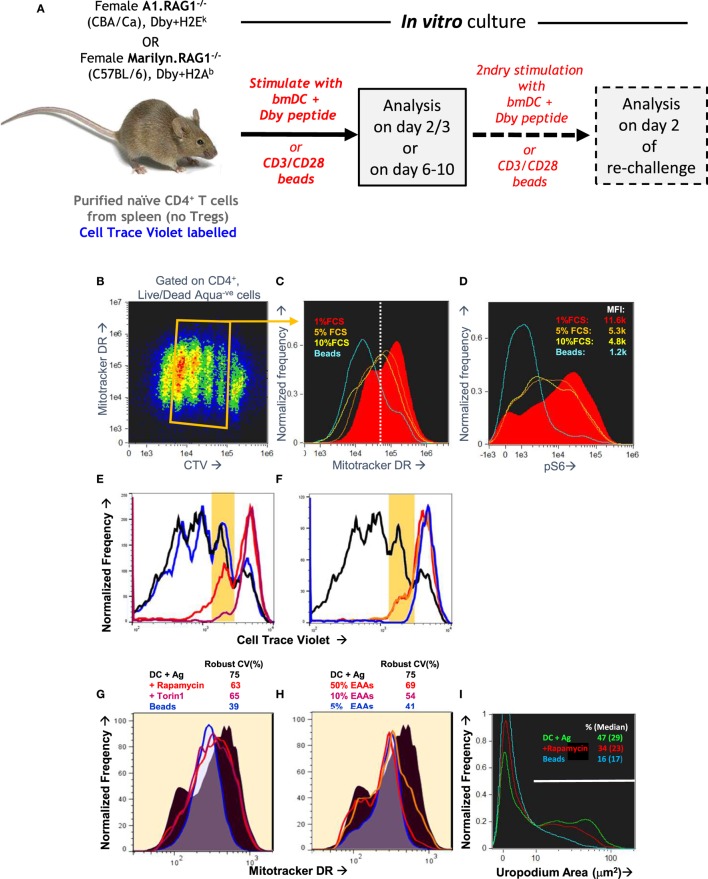
During an immune response, naïve CD4+ T cells proliferate and generate a range of effector, memory, and regulatory T cell subsets, but how these processes are co-ordinated remains unclear. A traditional model suggests that memory cells use mitochondrial respiration and are survivors from a pool of previously proliferating and glycolytic, but short-lived effector cells. A more recent model proposes a binary commitment to either a memory or effector cell lineage during a first, asymmetric cell division, with each lineage able to undergo subsequent proliferation and differentiation. We used improved fixation and staining methods with imaging flow cytometry in an optimized in vitro system that indicates a third model. We found that cell fates result from stochastic decisions that depend on GITR co-stimulation and which take place before any cell division. Effector cell commitment is associated with mTORC2 signaling leading to uropodium development, while developing memory cells lose mitochondria, have a nuclear localization of NFκB and depend on TGFβ for their survival. Induced, T helper subsets and foxp3+ regulatory T cells were found in both the effector and memory cell lineages. This in vitro model of T cell differentiation is well suited to testing how manipulation of cytokine, nutrient, and other components of the microenvironment might be exploited for therapeutic purposes.

Keywords: GITR; T cell differentiation; asymmetric cell division; cell fate; imaging flow cytometry; mTOR signaling; uropodium.


Figures

Figure 1
Figure 1
Masking and gating strategies for analysis of uropodia and cells in telophase. The strategy for making masks (blue shading) for nuclear expression and identification of uropodia is shown in (A). The bright field (Ch01) default mask (M01) was first eroded, either by two pixels or, when a significant number of images contained a lot of extraneous material (as seen at the bottom right of the example shown), by using an 80% adaptive erode (a) followed by a 5 or 6 pixel dilation, to generate a “clean” cell mask (b). The nuclear mask was then made using the morphology function of the DNA (7AAD, Ch05, mask M05, shown in c). The uropodium mask (f) was defined as the largest area single component of the clean cell mask (b) after subtraction of the nuclear mask (c) dilated by 6 pixels (d). (B–G) Image gating strategy for defining cells with uropodia. Images were gated for focus (B), size (bright field area) and non-apoptotic (low bright field contrast) (C). Note that it is essential that images are gated on diploid (ideally G0/G1 DNA staining intensity) with an aspect ratio >0.8 (i.e., a single, round nuclei) (D). Dead cells staining with live/dead aqua were excluded (E). The area of the uropodium mask for each image was then plotted on a frequency histogram (with a log scale for uropodium area) and cells with uropodia areas greater or lesser than 10 µm2 were defined as uropodia positive (red) or negative (blue), respectively (F). The uropodium mask was also used to show the proportion (%) of any stains of interest that were differentially expressed within or outside the uropodium mask [an example is shown for mitochondria in (G)]. (H–N) The strategy for making masks (blue shading) to identify and determine the polarity of telophase cells is shown. A cell mask was made by eroding the default bright field mask (M01) by two pixels (a). A nuclear mask was generated by applying the morphology function to the default DNA channel (Ch02, M02 for Sytox Green shown). The component function (component 1 and 2 sorted for largest area) was then used to identify the DNA staining for the two condensed sister nuclei (c, d) which were dilated by eight pixels (e, f) and then each was subtracted from the cell mask (a) to give the two sister “cell masks” (g, h). The gating strategy to identify cells in telophase (and late anaphase) is shown in (I–N). Images were gated for focus (I), size (bright field area), and non-apoptotic (low bright field contrast) (J), singlet cells with G2/M DNA content (K), and live cells excluding live/dead aqua (not shown). Cells in late anaphase and telophase were selected by gating for images with two nuclear components of similar DNA stain intensity (L) and low aspect ratios [i.e., with condensed “bar” shaped nuclei: (M)], with examples shown in (N) (DNA in blue, mitochondria in red, and CD4 in green).
Figure 1
Figure 1
Masking and gating strategies for analysis of uropodia and cells in telophase. The strategy for making masks (blue shading) for nuclear expression and identification of uropodia is shown in (A). The bright field (Ch01) default mask (M01) was first eroded, either by two pixels or, when a significant number of images contained a lot of extraneous material (as seen at the bottom right of the example shown), by using an 80% adaptive erode (a) followed by a 5 or 6 pixel dilation, to generate a “clean” cell mask (b). The nuclear mask was then made using the morphology function of the DNA (7AAD, Ch05, mask M05, shown in c). The uropodium mask (f) was defined as the largest area single component of the clean cell mask (b) after subtraction of the nuclear mask (c) dilated by 6 pixels (d). (B–G) Image gating strategy for defining cells with uropodia. Images were gated for focus (B), size (bright field area) and non-apoptotic (low bright field contrast) (C). Note that it is essential that images are gated on diploid (ideally G0/G1 DNA staining intensity) with an aspect ratio >0.8 (i.e., a single, round nuclei) (D). Dead cells staining with live/dead aqua were excluded (E). The area of the uropodium mask for each image was then plotted on a frequency histogram (with a log scale for uropodium area) and cells with uropodia areas greater or lesser than 10 µm2 were defined as uropodia positive (red) or negative (blue), respectively (F). The uropodium mask was also used to show the proportion (%) of any stains of interest that were differentially expressed within or outside the uropodium mask [an example is shown for mitochondria in (G)]. (H–N) The strategy for making masks (blue shading) to identify and determine the polarity of telophase cells is shown. A cell mask was made by eroding the default bright field mask (M01) by two pixels (a). A nuclear mask was generated by applying the morphology function to the default DNA channel (Ch02, M02 for Sytox Green shown). The component function (component 1 and 2 sorted for largest area) was then used to identify the DNA staining for the two condensed sister nuclei (c, d) which were dilated by eight pixels (e, f) and then each was subtracted from the cell mask (a) to give the two sister “cell masks” (g, h). The gating strategy to identify cells in telophase (and late anaphase) is shown in (I–N). Images were gated for focus (I), size (bright field area), and non-apoptotic (low bright field contrast) (J), singlet cells with G2/M DNA content (K), and live cells excluding live/dead aqua (not shown). Cells in late anaphase and telophase were selected by gating for images with two nuclear components of similar DNA stain intensity (L) and low aspect ratios [i.e., with condensed “bar” shaped nuclei: (M)], with examples shown in (N) (DNA in blue, mitochondria in red, and CD4 in green).
Figure 2
Figure 2
Optimization of an in vitro culture system of antigen-specific stimulation that recapitulates the bimodal distribution of mitochondria observed in vivo. (A) Schematic of an in vitro system to track the activation, proliferation, and differentiation of naïve CD4+ T cells at different time points after a primary stimulation, and after a secondary activation. (B–D) Naïve CD4+ T cells from A1RAG mice were labeled with cell trace violet (CTV) and stimulated in vitro with either bone marrow-derived dendritic cells (bmDC) plus 100 nM Dby peptide or CD3/CD28 beads (blue lines), in the presence of IL-2, TGFβ, and ATRA, for 3 days in Advanced RPMI with either 1% (red lines), 5% (orange lines), or 10% FCS (yellow lines) followed by “in situ” staining (see Materials and Methods) for Mitotracker DR, live/dead Aqua, CD4-PE-CF594, and CD44-APC-eflour780, fixation/permeabilization, followed by intracellular pS6-Alexa488 and 7AAD staining. ImageStream analysis was performed on 30,000 images per sample, gating on singlet cells as above, CD4+ and live/dead aqua negative, and plotting CTV against Mitotracker DR [(B) density plot of all samples pooled]. Individual samples were gated on cells that had divided 1–4 times (orange box) and the intensity histograms of Mitotracker DR (C) and pS6 (D) are shown. (E–H) CTV labeled A1RAG CD4+ T cells were stimulated as above with bmDC + Dby peptide, but in standard RPMI+ 10% dialyzed FCS, or with RPMI with reduced levels of essential amino acids, or with addition of mTOR inhibitors rapamycin or Torin 1, as indicated. CD3/CD28 bead stimulation was used as a control group. Mitotracker DR and live/dead aqua staining was performed at room temperature and the samples run on a Dako Cyan flow cytometer with analysis by FlowJo software. Live cells were gated on those that had divided exactly once by CTV dilution, as indicated by the areas shaded yellow in the CTV proliferation plots (E,F) to show their Mitotracker DR histograms (G,H). (I) A similar experiment to that in (B–D) was set up except that a DC+ peptide-stimulated group was treated with rapamycin, and the ImageStream analysis of uropodium area was performed as described in Section “Materials and Methods.”
Figure 3
Figure 3
Optimizing fixation and staining methodology. (A–D) CTV-labeled naïve female A1RAG CD4+ T cells were stimulated with bone marrow-derived dendritic cells+ 100 nM Dby peptide with IL2, TGFβ, and ATRA. Staining and fixation was performed in two different ways: either in “in situ” method at 37°C was used [(A) and red filled lines in (C,D)] or cells were conventionally harvested, spun down, and labeled in PBS+ 1% BSA with fixing and permeabilization all at 4°C [(B) and blue lines in (C,D)]. Cells were gated and uropodia area determined as described in Section “Materials and Methods.” One of two similar experiments is shown.
Figure 4
Figure 4
Antigen-specific CD4+ T cells undergoing a secondary graft rejection response have a bimodal distribution of mitochondria. (A) Schematic of the in vivo model used to compare secondary memory responses of antigen-specific CD4+ T cells to a challenge skin graft after rejection or induction of tolerance. (B–D) Draining lymph nodes were taken, 7 days after a secondary challenge with male skin, from female A1RAG mice that had been either been allowed to reject a male skin graft or had been made tolerant by anti-CD4 treatment (5 mice per group). Cells from each mouse were individually stained with Mitotracker DR, CD4-PE-CF594, CD44-APC-eflour780, and 7AAD and 20,000 images were acquired by ImageStream for each sample. Singlet, viable cell images were gated on 7AAD intensity (2N DNA) and high aspect ratio, bright field area, and low contrast. All rejecting (A) and tolerant (B) gated images are pooled and shown in the plots, and the percentage (mean ± SD) of activated CD4+CD44+ T cells (within yellow gates) are indicated. The Mitotracker DR intensity of individual rejecting and tolerant CD4+ gated cells [red (B) and blue (C) boxes] is plotted in (D).
Figure 5
Figure 5
The bimodal distribution of mitochondria represents two lineages of proliferating cells that either do, or do not, develop uropodia before the first cell division. (A) Explanatory diagram showing how pre-labeling with both cell trace violet (CTV) and Mitotracker DR allows the tracking of mitochondrial inheritance with cell division, while post-labeling with Mito-ID-Red indicates the total number of mitochondria per cell at the end of the culture, which shows that two separate lineages of cells proliferate in parallel and do not interconvert. (B–I) Naïve female A1RAG CD4+ T cells were labeled with both CTV and Mitotracker DR and stimulated with bone marrow-derived dendritic cells (bmDC) + 100 nM Dby peptide with IL-2, TGFβ, and ATRA, for 3 days. Cells were labeled “in situ” with CD4-APC-Cy7 and live/dead aqua, fixed and permeabilized, then stained with Mito-ID-Red and Sytox green, and 30,000 images acquired by ImageStream. All images were gated for live, singlet, G0/G1, and CTV+ cells. Panel (B) shows the dilution of Mitotracker DR with each cell division by CTV dilution. Panels (D–G) show histograms of the indicated parameters gated in (C) for each cell division (0 = Blue, 1 = green, 2 = yellow, 3 = orange, 4 = red) with pre-division activated blast cells [high mitochondria (gray box) and bright field area >90 μm2] and non-blasted cells [low mitochondria (dashed blue box) and bright field area <90 μm2]. Each population is further gated in panel (D) for high (green) or low (gray) total mitochondria (Mito-ID-Red stain). Panel (E) shows that the Mito-ID-Red high and low populations have either large (>10 μm2) or small/no (<10 μm2) uropodia, respectively, with very similar proportions of each across all cell divisions. While the Mito-ID-Red high populations show a regular twofold dilution of the pre-stained Mitotracker DR (F), the Mito-ID-Red low-gated cells lose most of their Mitotracker DR staining during their activation from non-blasted to pre-division blast cells [(G), white arrow], with regular twofold dilutions to a background of 4,000 after that. CTV was also lost at the same time point [(H), white arrow], but returned to regular twofold dilutions thereafter. One of two similar experiments is shown. In a separate experiment (I), CTV labeled A1RAG CD4+ T cells were stimulated, in the presence of IL2, TGFβ, and ATRA, with bmDC + Dby peptide, with (red line) or without (yellow line) rapamycin, or with CD3/CD28 beads (green line). Cultures were labeled at different time points (only 48 h shown) in situ, with autophagy green detection reagent (Abcam: 1/2,000), Mitotracker DR, CD4-PECF594, and CD44-APC-Cy7 for 40 min, then fixed with 2% formaldehyde at 37°C for 15 min. After a single wash in PBS+ 1% BSA, samples were immediately run on the ImageStream. Images were gated on focused, live, single CD4+ cells with undiluted CTV staining. One of three similar experiments is shown. See further analyses in Figure S1 in Supplementary Material.
Figure 6
Figure 6
The CD4+ T cell fate choice associated with uropodium development does not depend on asymmetric cell divisions. (A) Depiction of a binary cell fate decision as a result of an asymmetric first cell division. The effector and memory cell fates result from a differential inheritance of mitochondria, CD4, and PI3k signaling between the two daughters. (B) A stochastic cell fate decision to develop uropodia during initial activation and before any cell division. The chance of any individual cell becoming either an effector cell, and developing uropodia, or a memory cell without uropodia, depends on the balance of a number of interacting signaling pathways (e.g., GITR, mTORC1, mTORC2, and NFκB) during its initial activation. Symmetrical cell divisions can then take place regardless of the cell fate decision taken. (C–O) CTV labeled naïve CD4+ T cells from female A1RAG were stimulated with bone marrow derived dendritic cells + 100 nM Dby peptide with IL-2, TGFβ, and ATRA for 48 h (when the average number of cell divisions was only 0.7). No mitotic inhibitors were used. Cultures were labeled “in situ” with (C,L) CD4-APC-Cy7 and CD25-BV605 or (D,M) CD44-APC-eflour780, plus live/dead aqua and Mitotracker DR (C,E,N), and fixed at 37°C by the addition, without mixing or disturbing the cultures, of 40% formaldehyde to 10% v/v for 15 min. The medium and fixative were then carefully aspirated and fix/perm buffer added for 2 h at 37°C. Intracellular stains used were [(C) and where indicated]: IRF4-PE, RORγt-PE-CF594, 7AAD or [(D,P) and where indicated]: Sytox Green, Foxp3-PE-Cy7, NFκB-p65-APC or [(E) and where indicated]: Tbet-Alexa488, RORγt-PE-CF594, 7AAD followed by ImageStream analysis. Telophase and late anaphase cells were automatically gated and all identified cells expressing the marker of interest are included in the histograms of polarity scores (with numbers indicated). Cells in their first mitosis (i.e., undiluted CTV) are indicated in yellow, while cells from all subsequent divisions are in blue. Data shown are from ~850,000 images obtained by pooling four independent experiments (two under standard, one each under Th1 or Th2 cytokine conditions). A polarity score of 0 represents complete symmetry, while 100% represents full asymmetry. A polarity score threshold of 40% was set (representing a 2.4-fold difference in intensity between daughters). This threshold indicated apparent asymmetry for DNA staining in 10% of the telophase cells (consistent with the error in DNA intensity measurement: robust CV of G0/G1 peak = 30%). P values indicate the probability that the cells analyzed were sampled from a population, where 50% or more of the cells were asymmetric (Fishers exact test).
Figure 7
Figure 7
A depiction of the uropodium structure in lymphocytes. Adapted from Ref. (46). Uropodia are found at the back of activated lymphocytes that are migrating on a substrate, usually an intracellular matrix containing integrin ligands, such as ICAM-1 or fibronectin, toward a chemokine cue. The uropodium is organized as a large, finger-like projection by the cytoskeleton and microtubules, with the microtubule organizing center (MTOC) at its base. The polarization of the cell is maintained by the Scribble/Dig and Par3 complex, which are the same components that have been claimed to be needed for asymmetric cell divisions (8). It is thought that the uropodium is responsible for the interaction of T cells with other cells, such as antigen-presenting cells and targets of cytotoxicity, and, therefore, expresses high levels of TCR, CD4/8, and relevant adhesion molecules (CD44, CD29). The cytotoxic granules of effector T cells are also present within the uropodium, and cytokines are secreted from them. Mitochondria, and many other organelles are also concentrated within the uropodium, which contains the bulk of the cell cytoplasm.
Figure 8
Figure 8
Confirming that the image masking strategy used is correctly identifying uropodia containing high numbers of mitochondria, high CD4 and CD44 expression, and mTOR signaling. (A–C) CTV-labeled naïve female A1RAG CD4+ T cells were stimulated with bone marrow-derived dendritic cells (bmDC) + 100 nM Dby peptide with IL2, TGFβ, and ATRA for 3 days. Cells were labeled “in situ” with CD4-PE-CF594, CD44-APC-Cy7, Mitotracker DR, and live/dead aqua, fixed and permeabilized, and intracellularly stained for γ-tubulinAlexaFluor488, and foxp3-PE-Cy7. Example images are shown in (A). The distribution of nuclear foxp3 staining was identical comparing cells with or without uropodia (B) and γ-tubulin staining, indicating the microtubule organizing center (MTOC) was strongly associated with uropodia (C). (D–N) CTV labeled naïve A1RAG CD4+ T cells were stimulated with bmDC + 100 nM peptide under optimized conditions (see Materials and Methods) for 3 days and then “in situ” labeled with CD4-PE-CF594, CD44-APC-eflour780, CD62L-BV605 (not shown), live/dead aqua and Mitotracker DR, fixed and permeabilized, then stained with pS6-Alexa488, pAKTS473-PE, Foxp3-PE-Cy7 (not shown), and 7AAD for ImageStream analysis. All images were gated for live, singlet cells in G0/G1 as previously. Example images, with uropodia masks indicated, are shown in (L), and cells with a uropodium area greater or lesser than 10 µm2 were defined as positive (red filled histograms) or negative (blue histograms), respectively. (E–I) Show the intensity histograms for each stain of interest, while (J–N) show the proportions of each stain that fall within the uropodium gate for each image. Median values for each plot are indicated. Shown are representative examples of three or more independent experiments.
Figure 9
Figure 9
Development of uropodia is associated with strong pAKT473/TORC2 signaling, intermediate pS6/TORC1 activity, and low NFκB signaling. (A–J) Cell trace violet (CTV) labeled female A1RAG CD4+ T cells were stimulated for 3 days in IL-2, TGFβ, and ATRA, with bone marrow-derived dendritic cells (bmDC) while the Dby peptide was titrated from 500 nM down to zero [examples shown in (A–C) and (F–H)] or CD3/CD28 beads were used as stimulation either alone (D,I) or together with DC but not Dby peptide (E,J). Cultures were labeled “in situ” with CD4-PE-CF594, CD44-APC-eflour780, Mitotracker DR and live/dead aqua, fixed and permeabilized, followed by staining with pS6-Alexa488, pAKTS473-PE, and 7AAD for ImageStream analysis. Gating was for live, singlet cells in G0/G1 that had not diluted their CTV (i.e., before any cell division). The uropodia area distributions of the six populations gated in panels (A–E) are color-coded and shown in the histograms of panels (F–J), respectively. Large uropodia were only induced in cells stimulated with bmDC plus Dby peptide, and where pAKTS473 was high and pS6 was simultaneously intermediate or low (red boxes). One of three similar experiments is shown. (K–M) shows a similar experimental set up (1 of 2) except that a pan-AKT-Alexa488 antibody was used in combination with the pAKTS473-PE staining, showing that total AKT was not restricted to the uropodia [example images in (K) and histogram in (L)] while pAKTS473, indicating signaling, was uropodia restricted (M). Median values for % within uropodia are shown. (N–R) The experiment shown (1 of 3) used either bmDC + 100 nM Dby peptide or CD3/CD28 bead stimulation, was labeled “in situ” with live/dead aqua and CD25-BV605 (not shown), fixed and permeabilized, then stained intracellularly with CD4-PE-CF594, CD3-APC-Cy7, NFκB-p65-APC, (Foxp3-PE-Cy7, CD95-FITC, not shown) for ImageStream analysis. Example images of cells with and without uropodia (stimulated by bmDC + Dby) are shown (N) while all live, singlet G0/G1, DC + Dby (filled blue), or CD3/CD28 bead (yellow) stimulated cells are shown in the histogram of uropodium area (O). Histograms of the CTV dilution profiles of bmDC stimulated cells either with (filled red histograms) or without (blue lines) uropodia, or CD3/CD28 bead stimulated cells (yellow lines) are shown in (P) with the mean number of cell divisions indicated. The intensity histograms for total NFκB-p65 (Q) or NFκB restricted to the nucleus (R) are shown with median intensity values indicated.
Figure 9
Figure 9
Development of uropodia is associated with strong pAKT473/TORC2 signaling, intermediate pS6/TORC1 activity, and low NFκB signaling. (A–J) Cell trace violet (CTV) labeled female A1RAG CD4+ T cells were stimulated for 3 days in IL-2, TGFβ, and ATRA, with bone marrow-derived dendritic cells (bmDC) while the Dby peptide was titrated from 500 nM down to zero [examples shown in (A–C) and (F–H)] or CD3/CD28 beads were used as stimulation either alone (D,I) or together with DC but not Dby peptide (E,J). Cultures were labeled “in situ” with CD4-PE-CF594, CD44-APC-eflour780, Mitotracker DR and live/dead aqua, fixed and permeabilized, followed by staining with pS6-Alexa488, pAKTS473-PE, and 7AAD for ImageStream analysis. Gating was for live, singlet cells in G0/G1 that had not diluted their CTV (i.e., before any cell division). The uropodia area distributions of the six populations gated in panels (A–E) are color-coded and shown in the histograms of panels (F–J), respectively. Large uropodia were only induced in cells stimulated with bmDC plus Dby peptide, and where pAKTS473 was high and pS6 was simultaneously intermediate or low (red boxes). One of three similar experiments is shown. (K–M) shows a similar experimental set up (1 of 2) except that a pan-AKT-Alexa488 antibody was used in combination with the pAKTS473-PE staining, showing that total AKT was not restricted to the uropodia [example images in (K) and histogram in (L)] while pAKTS473, indicating signaling, was uropodia restricted (M). Median values for % within uropodia are shown. (N–R) The experiment shown (1 of 3) used either bmDC + 100 nM Dby peptide or CD3/CD28 bead stimulation, was labeled “in situ” with live/dead aqua and CD25-BV605 (not shown), fixed and permeabilized, then stained intracellularly with CD4-PE-CF594, CD3-APC-Cy7, NFκB-p65-APC, (Foxp3-PE-Cy7, CD95-FITC, not shown) for ImageStream analysis. Example images of cells with and without uropodia (stimulated by bmDC + Dby) are shown (N) while all live, singlet G0/G1, DC + Dby (filled blue), or CD3/CD28 bead (yellow) stimulated cells are shown in the histogram of uropodium area (O). Histograms of the CTV dilution profiles of bmDC stimulated cells either with (filled red histograms) or without (blue lines) uropodia, or CD3/CD28 bead stimulated cells (yellow lines) are shown in (P) with the mean number of cell divisions indicated. The intensity histograms for total NFκB-p65 (Q) or NFκB restricted to the nucleus (R) are shown with median intensity values indicated.
Figure 10
Figure 10
Uropodia development before first cell division depends on GITR signaling through mTORC2 and NFκB. (A–F) Cell trace violet (CTV) labeled female A1RAG CD4+ T cells were stimulated in the presence of IL-2, TGFβ, and ATRA with either bone marrow-derived dendritic cells (bmDC) + 100 nM Dby peptide (red, dashed histograms), CD3/CD28 beads (blue lines), or different concentrations (0.1 µg/ml, white lines; 1.0 µg/ml, green lines; or 5 µg/ml, yellow lines) of anti-CD3 antibody coated on the tissue culture plastic, each concentration plus 1 µg/ml anti-CD28 (37.51) in solution. In panels (D–F) an agonist antibody to GITR (YGITR 765.4) was also coated at 1 µg/ml on the plastic. After 3 days, cultures were labeled “in situ” with CD4-PE-CF594, CD25-BV605, CD44-APC-eflour780, and live/dead aqua, fixed and permeabilized, followed by intracellular staining for pS6-Alexa488, pAKTS473-PE, NFκB-p65-APC, and 7AAD. Images for histograms shown were gated on live, singlet, CTV+, G0/G1 DNA content cells, and the proportion (%) of cells that developed uropodia [>10 μm2: (A,D)], stained for nuclear expression of NFκB (B,E) and pAKTS473 (C,F) are indicated. One of two similar experiments is shown. (G–P) An experiment similar to that above was set up, except that all cultures were stimulated by bmDC + 100 nM Dby, either alone [example images in (G), histograms in (H–J)], or with the addition of a blocking antibody to GITRL [YGL 386: (K–M)] or an FcR-binding, agonist antibody to GITR [YGITR 765: (N–P)], both at 10 µg/ml in solution. Yellow filled histograms are gated on cells which have not divided (undiluted CTV), while dashed red histograms are gated on cells that have divided once or more. Median values are indicated. One of two similar experiments is shown.
Figure 10
Figure 10
Uropodia development before first cell division depends on GITR signaling through mTORC2 and NFκB. (A–F) Cell trace violet (CTV) labeled female A1RAG CD4+ T cells were stimulated in the presence of IL-2, TGFβ, and ATRA with either bone marrow-derived dendritic cells (bmDC) + 100 nM Dby peptide (red, dashed histograms), CD3/CD28 beads (blue lines), or different concentrations (0.1 µg/ml, white lines; 1.0 µg/ml, green lines; or 5 µg/ml, yellow lines) of anti-CD3 antibody coated on the tissue culture plastic, each concentration plus 1 µg/ml anti-CD28 (37.51) in solution. In panels (D–F) an agonist antibody to GITR (YGITR 765.4) was also coated at 1 µg/ml on the plastic. After 3 days, cultures were labeled “in situ” with CD4-PE-CF594, CD25-BV605, CD44-APC-eflour780, and live/dead aqua, fixed and permeabilized, followed by intracellular staining for pS6-Alexa488, pAKTS473-PE, NFκB-p65-APC, and 7AAD. Images for histograms shown were gated on live, singlet, CTV+, G0/G1 DNA content cells, and the proportion (%) of cells that developed uropodia [>10 μm2: (A,D)], stained for nuclear expression of NFκB (B,E) and pAKTS473 (C,F) are indicated. One of two similar experiments is shown. (G–P) An experiment similar to that above was set up, except that all cultures were stimulated by bmDC + 100 nM Dby, either alone [example images in (G), histograms in (H–J)], or with the addition of a blocking antibody to GITRL [YGL 386: (K–M)] or an FcR-binding, agonist antibody to GITR [YGITR 765: (N–P)], both at 10 µg/ml in solution. Yellow filled histograms are gated on cells which have not divided (undiluted CTV), while dashed red histograms are gated on cells that have divided once or more. Median values are indicated. One of two similar experiments is shown.
Figure 11
Figure 11
CD4+ T cells with uropodia are effector cells co-expressing random combinations of T cell subset transcription factors. (A–F) Cell trace violet (CTV) labeled female MARKI CD4+ T cells were stimulated as indicated with either CD3/CD28 beads (A,D) or bone marrow-derived dendritic cells (bmDC) + 10 nM Dby peptide (B,C,E,F), for 2 days with IL-2, TGFβ, and ATRA. Cultures were labeled “in situ” with CD4-APC-Cy7, live/dead aqua, and Mitotracker DR, fixed and permeabilized, and intracellularly for pS6-Alexa 488, GATA3-PE, RORγt-PE-CF594, Foxp3-PE-Cy7, Tbet-BV605, and 7AAD. 50,000 images were acquired per sample, and gated for live singlet cells in G0/G1 with [(B,E) area >10 μm2 in green] or without [(C,F) area <10 μm2 in red] uropodia, and, using CTV dilution, for cells that had not yet divided (A–C) or had divided once or more (D–F). Dot plots show the intensity of nuclear staining for RORγt versus GATA3, with co-expression of nuclear Foxp3 (yellow) or Tbet (blue) also indicated. One of five similar experiments is shown (two with MARKI, three with A1RAG).
Figure 12
Figure 12
CD4+ T cells with uropodia are short-lived effector cells co-expressing random combinations of T cell subset cytokines and granzyme B. (A–F) CTV labeled female A1RAG CD4+ T cells were stimulated in the presence of IL-2, TGFβ, and ATRA with bmDC + 100 nM Dby peptide for 3 days. Brefeldin was added to the cultures for 2 h before they were labeled “in situ” with CD4-APC-Cy7, live/dead aqua, and Mitotracker DR, fixed and permeabilized, and then intracellularly for IL2-FITC, IFNγ-PE, IL4-PE-CF594, IL17-BV605, Foxp3-PE-Cy7, and 7AAD. Images were gated, as above, for those with [(A) red dots and (C–F) red filled histograms] or without [(A) blue dots and (C–F) blue histograms] uropodia. Median values of staining intensities for each cytokine are shown in (C–F), and example images in (B). One of two similar experiments is shown. (G–I) CTV labeled female A1RAG CD4+ T cells were stimulated in the presence of IL-2, TGFβ, and ATRA with bmDC + 100 nM Dby peptide for 3 days. Cultures were labeled “in situ” with CD4-PE-CF594, CD3-APC-Cy7, CD62L-BV605, Mitotracker DR, and live/dead aqua, fixed and permeabilized, and intracellularly stained for γ-tubulin-Alexa488, granzyme B (GZMB–PE), and foxp3-PE-Cy7. Example images are shown in (G). The intensity of granzyme B staining, with median values indicated (H) and the proportion of this staining falling within uropodia (I), with median % indicated, for foxp3 negative cells either with (filled red) or without (blue) uropodia, as well as for nuclear foxp3+ cells (dashed yellow), are shown (one of two similar experiments). (J–M) CTV labeled female A1RAG CD4+ T cells were stimulated with bmDC + 100 nM Dby plus IL2, TGFβ, and ATRA for 7 days and labeled “in situ” for Mitotracker DR and live/dead aqua, fixed and permeabilized, and stained for CD4-PE-CF594 and 7AAD. In focus, images were gated for singlet cells with a G0/G1 DNA content. Histograms show the absolute frequencies of live cells (live/dead aqua negative, bright field contrast low: blue histograms) compared to dead/dying cells (apoptotic = bright field contrast high plus necrotic = live/dead aqua positive: filled red) in each plot, comparing cell divisions (J), uropodium area (K), Mitotracker DR staining (L), and CD4 (M), with median values indicated. Representative data from many (>10) similar experiments are shown.
Figure 13
Figure 13
Nuclear NFkB is maintained in long-lived memory cells without uropodia even when they reach quiescence and mTOR activation has ceased. Cell trace violet (CTV) labeled female A1RAG CD4+ T cells were stimulated for 3 or 6 days in the presence of IL-2, TGFβ, and ATRA with bone marrow-derived dendritic cells + 100 nM Dby peptide (3 days in yellow, 6 days green) or CD3/CD28 beads (only day 6 shown in blue). “In situ” staining, fixation, and image analysis was a previously described, with histograms for CTV (A), pS6-Alexa488 (B), and pAKTS473 (C) shown. Data from one of many (>10) similar experiments are shown. (D–F) An identical experiment to that above was set up, with DC + Ag stimulation analyzed on day 3 (yellow) or day 7 (green) and CD3/CD28 bead stimulation on day 3 (blue). Histograms show CTV with mean number of divisions indicated (D) and the intensities (with median values shown) of total (E) or nuclear (F) NFκB (p65)-APC staining. One of two similar experiments is shown.
Figure 14
Figure 14
Long-lived memory CD4+ T cells, without uropodia, have a lower threshold for re-stimulation, when they make further, independent fate decisions to develop uropodia or re-express CD62L. (A–C) Cell trace violet (CTV) labeled female A1RAG CD4+ T cells were stimulated with bone marrow-derived dendritic cells (bmDC) + 100 nM Dby for 3 days in the presence of IL2 (50 U/ml) without TGFβ (A), IL2 (50 U/ml) plus TGFβ (2 ng/ml) (B), or TGFβ plus anti-IL2 (clone S4B6, 50 µg/ml) (C). Cells were “in situ” labeled with live/dead aqua, fixed and permeabilized, then 7AAD. Histograms show the absolute frequencies of CTV dilution, with gray dashed lines for all images (both live and dead), while filled red (cells with uropodia >10 mm2) and blue line (cells without uropodia) histograms are gated for live cells only (live/dead aqua negative, bright field contrast low). Total numbers of cells in each histogram are indicated. One of two similar experiments is shown. (D–F) CTV labeled female MARKI CD4+ T cells were stimulated with bmDC + 10 nM Dby peptide with IL2 (50 U/ml) either with (E,F) or without (D) TGFβ (2 ng/ml) for 10 days. Cells were “in situ” labeled with live/dead aqua and Mitotracker DR (not shown), fixed and permeabilized, then Tbet-Alexa488, foxp3-PE-Cy7, (GATA3-PE, RORγt-PE-CF594, CD4-APC-Cy7, all not shown), and 7AAD. Histograms of absolute frequencies of CTV dilution for total live and dead singlet cells (dashed gray), live cells with (filled red), and without (blue lines) uropodia, together with total numbers of cells are shown (D,E). The intensities of Tbet and foxp3 staining within the nucleus of the live cells without uropodia are plotted in (F). A similar result was also observed using female A1RAG CD4+ T cell 10 day cultures (not shown). (G–I) Female A1RAG CD4+ T cells (not CTV labeled) were stimulated in the presence of IL-2, TGFβ, and ATRA with bmDC + 100 nM Dby peptide (G,H) or CD3/CD28 beads (I) for 6 days. An aliquot of each sample was analyzed as above for uropodia area, CD62L, and nuclear foxp3 expression (summarized in orange panels). Cells were harvested, Ficoll–Hypaque separated, labeled with CTV and Mitotracker DR, then re-stimulated with either CD3/CD28 beads (G) or bmDC + 100 nM Dby peptide (H,I) for 3 days. Cultures were labeled “in situ” with CD4-PE-CF594, CD44-APC-eflour780, CD62L-BV605, and live/dead aqua, fixed and permeabilized, and intracellularly stained for foxp3-PE-Cy7 (Mito-ID-Red, pAKTS473-PE, not shown) and Sytox Green for DNA. Plots show the intensity of CD44 and CD62L staining, with % in each quadrant indicated, after gating for live singlet cells with G0/G1 DNA content, and nfoxp3 cells with uropodia (area >10 μm2: percentage and median area shown in panel above) in red, without uropodia in blue, and nuclear foxp3+ cells (% of all cells shown in panel above) with or without uropodia shown in orange and yellow, respectively. One of three similar experiments is shown.

Similar articles

Cited by

References

    1. Kaech SM, Hemby S, Kersh E, Ahmed R. Molecular and functional profiling of memory CD8 T cell differentiation. Cell (2002) 111(6):837–51.10.1016/S0092-8674(02)01139-X - DOI - PubMed
    1. Pearce EL, Shen H. Making sense of inflammation, epigenetics, and memory CD8+ T-cell differentiation in the context of infection. Immunol Rev (2006) 211:197–202.10.1111/j.0105-2896.2006.00399.x - DOI - PubMed
    1. O’Sullivan D, van der Windt GJ, Huang SC, Curtis JD, Chang CH, Buck MD, et al. Memory CD8 T cells use cell-intrinsic lipolysis to support the metabolic programming necessary for development. Immunity (2014) 41(1):75–88.10.1016/j.immuni.2014.06.005 - DOI - PMC - PubMed
    1. Dawicki W, Bertram EM, Sharpe AH, Watts TH. 4-1BB and OX40 act independently to facilitate robust CD8 and CD4 recall responses. J Immunol (2004) 173(10):5944–51.10.4049/jimmunol.173.10.5944 - DOI - PubMed
    1. Sabbagh L, Snell LM, Watts TH. TNF family ligands define niches for T cell memory. Trends Immunol (2007) 28(8):333–9.10.1016/j.it.2007.06.001 - DOI - PubMed