

Effect of Task Failure on Intermuscular Coherence Measures in Synergistic Muscles
- PMID: 29967654
- PMCID: PMC6008706
- DOI: 10.1155/2018/4759232
Effect of Task Failure on Intermuscular Coherence Measures in Synergistic Muscles
Abstract
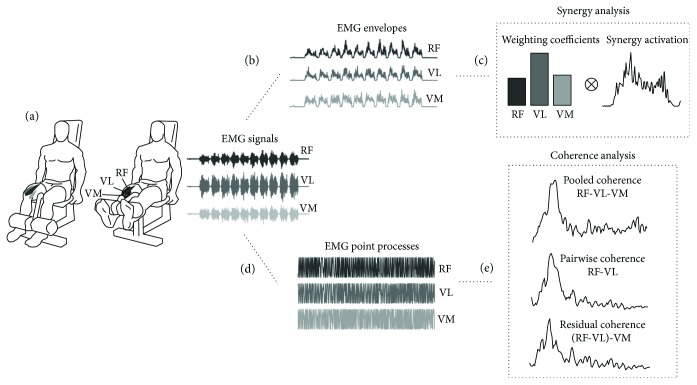
The term "task failure" describes the point when a person is not able to maintain the level of force required by a task. As task failure approaches, the corticospinal command to the muscles increases to maintain the required level of force in the face of a decreased mechanical efficacy. Nevertheless, most motor tasks require the synergistic recruitment of several muscles. How this recruitment is affected by approaching task failure is still not clear. The increase in the corticospinal drive could be due to an increase in synergistic recruitment or to overlapping commands sent to the muscles individually. Herein, we investigated these possibilities by combining intermuscular coherence and synergy analysis on signals recorded from three muscles of the quadriceps during dynamic leg extension tasks. We employed muscle synergy analysis to investigate changes in the coactivation of the muscles. Three different measures of coherence were used. Pooled coherence was used to estimate the command synchronous to all three muscles, pairwise coherence the command shared across muscle pairs and residual coherence the command peculiar to each couple of muscles. Our analysis highlights an overall decrease in synergistic command at task failure and an intensification of the contribution of the nonsynergistic shared command.
Figures


Similar articles
-
Estimation of Time-Varying Coherence Amongst Synergistic Muscles During Wrist Movements.Front Neurosci. 2018 Aug 7;12:537. doi: 10.3389/fnins.2018.00537. eCollection 2018. Front Neurosci. 2018. PMID: 30131672 Free PMC article.
-
Intermuscular coherence contributions in synergistic muscles during pedaling.Exp Brain Res. 2015 Jun;233(6):1907-19. doi: 10.1007/s00221-015-4262-4. Epub 2015 Mar 28. Exp Brain Res. 2015. PMID: 25821181
-
Task-Dependent Intermuscular Motor Unit Synchronization between Medial and Lateral Vastii Muscles during Dynamic and Isometric Squats.PLoS One. 2015 Nov 3;10(11):e0142048. doi: 10.1371/journal.pone.0142048. eCollection 2015. PLoS One. 2015. PMID: 26529604 Free PMC article. Clinical Trial.
-
Parkinson's Disease Exhibits Amplified Intermuscular Coherence During Dynamic Voluntary Action.Front Neurol. 2020 Apr 3;11:204. doi: 10.3389/fneur.2020.00204. eCollection 2020. Front Neurol. 2020. PMID: 32308641 Free PMC article.
-
Muscle coactivation: definitions, mechanisms, and functions.J Neurophysiol. 2018 Jul 1;120(1):88-104. doi: 10.1152/jn.00084.2018. Epub 2018 Mar 28. J Neurophysiol. 2018. PMID: 29589812 Free PMC article. Review.
Cited by
-
Muscle Synergy Analysis as a Tool for Assessing the Effectiveness of Gait Rehabilitation Therapies: A Methodological Review and Perspective.Bioengineering (Basel). 2024 Aug 5;11(8):793. doi: 10.3390/bioengineering11080793. Bioengineering (Basel). 2024. PMID: 39199751 Free PMC article. Review.
-
Intermuscular coherence between homologous muscles during dynamic and static movement periods of bipedal squatting.J Neurophysiol. 2020 Oct 1;124(4):1045-1055. doi: 10.1152/jn.00231.2020. Epub 2020 Aug 20. J Neurophysiol. 2020. PMID: 32816612 Free PMC article.
-
Regional recruitment and differential behavior of motor units during postural control in older adults.J Neurophysiol. 2023 Nov 1;130(5):1321-1333. doi: 10.1152/jn.00068.2023. Epub 2023 Oct 25. J Neurophysiol. 2023. PMID: 37877159 Free PMC article.
References
-
- Castronovo A. M., De Marchis C., Bibbo D., Conforto S., Schmid M., D’Alessio T. Neuromuscular adaptations during submaximal prolonged cycling. 2012 Annual International Conference of the IEEE Engineering in Medicine and Biology Society; August-September 2012; San Diego, CA, USA. pp. 3612–3615. - DOI - PubMed
LinkOut - more resources
Full Text Sources
Other Literature Sources
Research Materials
