. 2018 Jun 27:6:e4976.
doi: 10.7717/peerj.4976. eCollection 2018.

Transcriptome profiling by RNA-Seq reveals differentially expressed genes related to fruit development and ripening characteristics in strawberries (Fragaria × ananassa)

Affiliations

Transcriptome profiling by RNA-Seq reveals differentially expressed genes related to fruit development and ripening characteristics in strawberries (Fragaria × ananassa)

Panpan Hu et al. PeerJ. .

Abstract

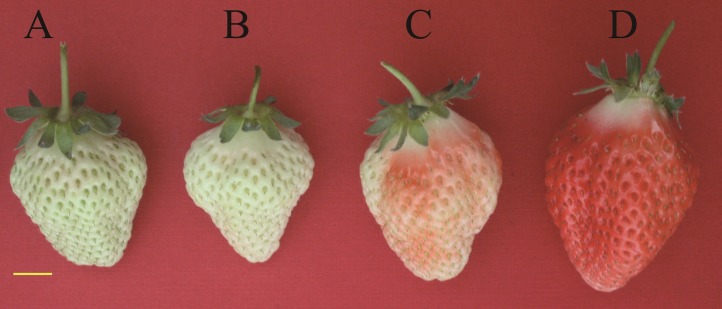
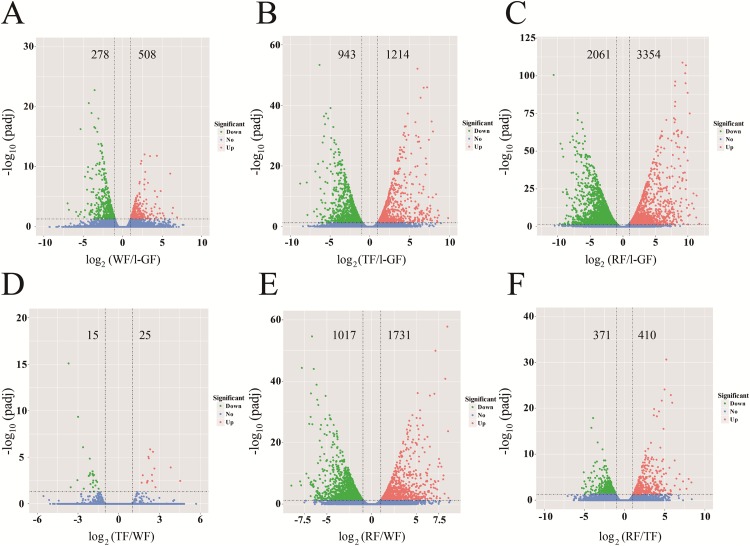
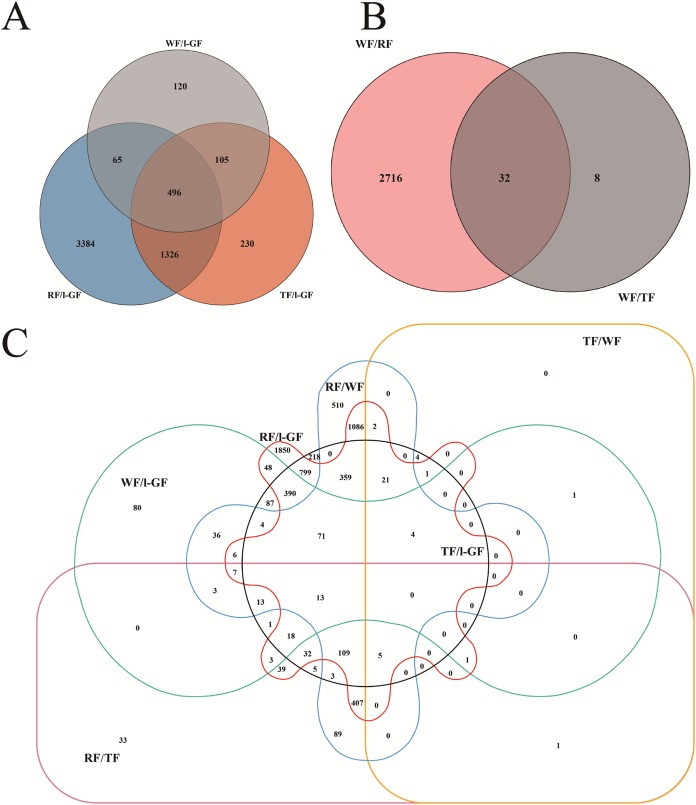
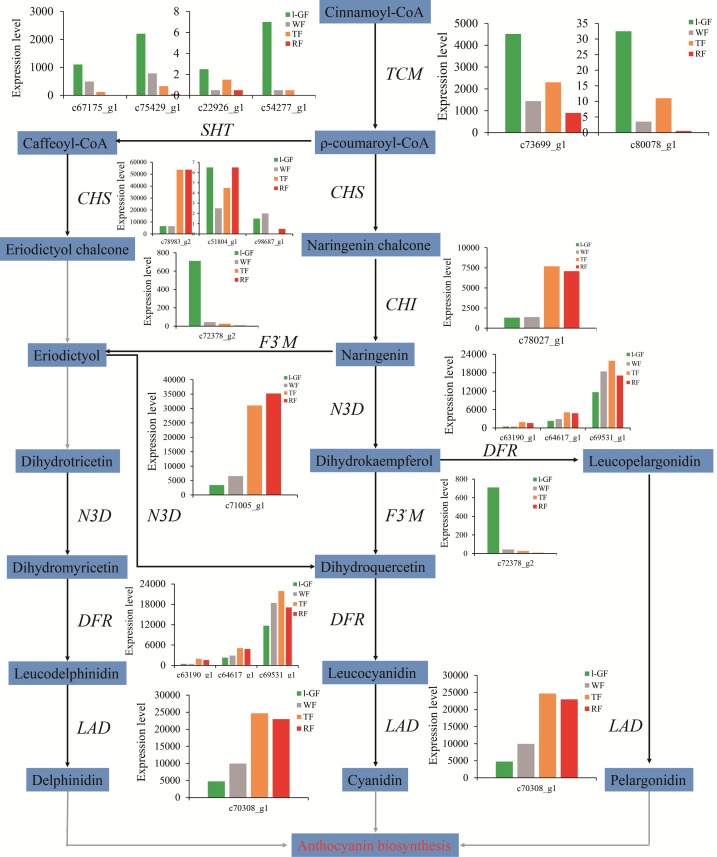
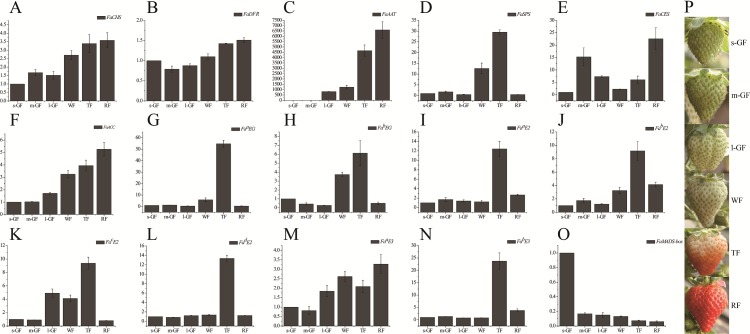
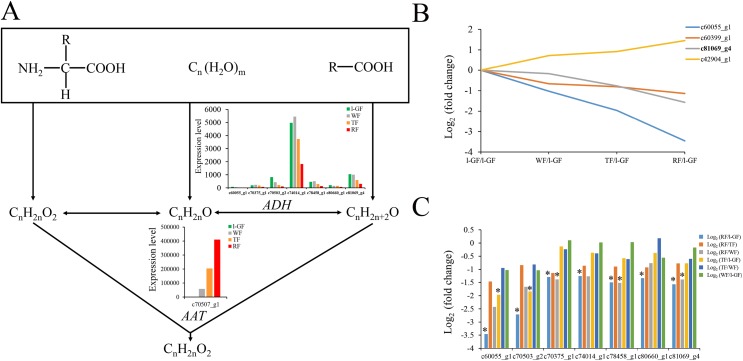
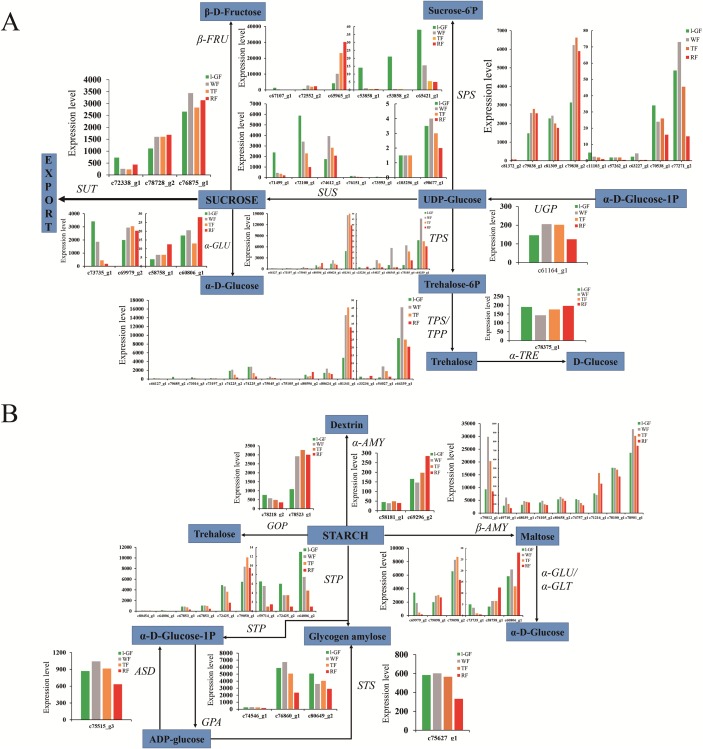
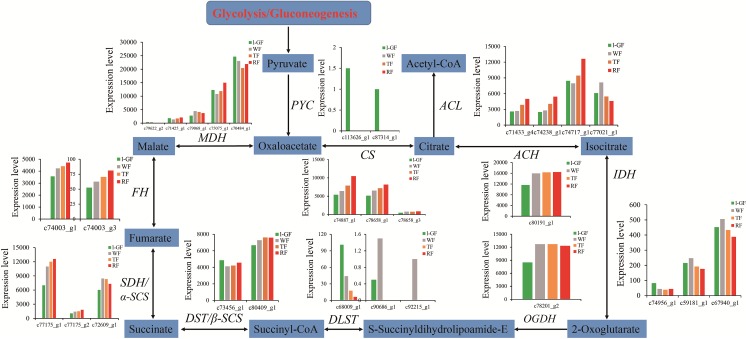
Strawberry (Fragaria × ananassa) is an ideal plant for fruit development and ripening research due to the rapid substantial changes in fruit color, aroma, taste, and softening. To gain deeper insights into the genes that play a central regulatory role in strawberry fruit development and ripening characteristics, transcriptome profiling was performed for the large green fruit, white fruit, turning fruit, and red fruit stages of strawberry. A total of 6,608 differentially expressed genes (DEGs) with 2,643 up-regulated and 3,965 down-regulated genes were identified in the fruit development and ripening process. The DEGs related to fruit flavonoid biosynthesis, starch and sucrose biosynthesis, the citrate cycle, and cell-wall modification enzymes played important roles in the fruit development and ripening process. Particularly, some candidate genes related to the ubiquitin mediated proteolysis pathway and MADS-box were confirmed to be involved in fruit development and ripening according to their possible regulatory functions. A total of five ubiquitin-conjugating enzymes and 10 MADS-box transcription factors were differentially expressed between the four fruit ripening stages. The expression levels of DEGs relating to color, aroma, taste, and softening of fruit were confirmed by quantitative real-time polymerase chain reaction. Our study provides important insights into the complicated regulatory mechanism underlying the fruit ripening characteristics in Fragaria × ananassa.

Keywords: Differentially expressed gene; Fruit ripening; Strawberry; Transcriptome.


Conflict of interest statement

The authors declare that they have no competing interests.

Figures

Figure 1
Figure 1. Tissues of strawberry “Toyonoka” used in deep sequencing.
(A) l-GF; (B) WF; (C) TF; (D) RF. Yellow bar = 10 mm. Photo credit: Panpan Hu.
Figure 2
Figure 2. The volcano plots of DEGs in six combinations.
(A) WF/l-GF; (B) TF/l-GF; (C) RF/l-GF; (D) TF/WF; (E) RF/WF; (F) RF/TF. The x-axis represents the gene expression times. The y-axis represents the statistically significant degree of gene expression change. The smaller the corrected p-value, the larger the −log10 (padj), and the more significant the difference. The scattered dots represent each gene, the blue dots indicate genes with no significant differences, the red dots indicate up-regulated genes with significant differences, and the green dots indicate down-regulated genes with significant differences.
Figure 3
Figure 3. Venn diagrams for the different DEGs between each combination.
(A) Number of common and specific DEGs in WF/l-GF, TF/l-GF, and RF/l-GF. (B) Number of common and specific DEGs in TF/WF and RF/WF. (C) Number of common and specific DEGs in six combinations (WF/l-GF, TF/l-GF, RF/l-GF, TF/WF, RF/WF, and RF/TF). The sum of the numbers in each large circle represents the total number of DEGs in the comparison, and the overlapping parts of the circle represent the number of common DEGs among the combinations.
Figure 4
Figure 4. The expression pattern of genes involved in anthocyanin biosynthesis.
Enzyme names, unigene ids and expression patterns are indicated on each step. The y-axis represents average read_count value of each library. No gene is found in the grey line step. Study sites: TCM, trans-cinnamate 4-monooxygenase; SHT, shikimate O-hydroxycinnamoyl transferase; CHS, chalcone synthase; CHI, chalcone isomerase; F3M, flavonoid 3-monooxygenase; N3D, naringenin 3-dioxygenase; DFR, bifunctional dihydroflavonol-4-reductase; LAD, leucoanthocyanidin dioxygenase; ANS, anthocyanidin reductase.
Figure 5
Figure 5. Expression profile of candidate genes during different fruit development and ripening stages in qRT-PCR.
qRT-PCR analysis of strawberry candidate gene (A) FaCHS; (B) FaDFR; (C) FaAAT; (D) FaSPS; (E) FaCES; (F) FaACC; (G) FaaEG; (H) FabEG; (I) FaaE2; (J) FabE2; (K) Fa cE2; (L) Fa dE2; (M) Fa aE3; (N) Fa bE3; (O) FaMADS-box. (P) Tissues of strawberry ‘Toyonoka’ used in qRT-PCR. CHS, chalcone synthase; DFR, bifunctional dihydroflavonol 4-reductase; AAT, alcohol acyltransferase; SPS, sucrose-phosphate synthase 1; CES, cellulose synthase A catalytic sub-unit 4; ACC, Acetyl-coenzyme A carboxylase carboxyl transferase sub-unit alpha; aEG, endoglucanase CX-like; bEG, endoglucanase 24-like; aE2, ubiquitin-conjugating enzyme E2 5-like; bE2, ubiquitin-conjugating enzyme E2 23-like; cE2, ubiquitin-conjugating enzyme E2 28-like; dE2, ubiquitin-conjugating enzyme E2 4-like; aE3, E3 ubiquitin-protein ligase UPL3-like; bE3, cullin-1-like; MADS-box, MADS-box protein ZMM17-like. FaActin were used as an internal control. Result shows expression value of candidate genes relative to s-GF stage. The experiments were repeated three times and provided consistent results. The mean values and error bars were obtained from three biological and three technical replicates.
Figure 6
Figure 6. The expression pattern of genes involved in ester biosynthesis.
(A) Ester biosynthesis pathway. Enzyme names, unigene ids and expression patterns are indicated on each step. The y-axis represents average read_count value of each library. ADH, alcohol dehydrogenase; AAT, alcohol acyltransferase. (B) The relative expression of down-regulated genes in the degradation of aromatic compound pathway. Black fonts indicate the up-regulated gene ID. (C) The expression pattern of DEGs in the degradation of aromatic compound pathway. The asterisk (*) indicates that the gene is satisfied the differentially expression analysis criteria (padj < 0.05 and log2 (fold change) ≥ 1 or log2 (fold change) ≤ −1) in the corresponding comparative combination.
Figure 7
Figure 7. The expression pattern of genes involved in starch and sucrose biosynthesis.
(A) Sucrose biosynthesis pathway. (B) Starch biosynthesis pathway. Enzyme names, unigene ids and expression patterns are indicated on each step. The y-axis represents average read_count value of each library. Study sites: β-FRU, β-fructofuranosidase; α-GLU, α-glucosidase; SUT, sucrose translocase; SUS, sucrose synthase; SPS, sucrose-phosphate synthase; TPS, trehalose 6-phosphate synthase; TPP, trehalose 6-phosphate phosphatase; α-TRE, α-trehalase; UGP, UTP—glucose-1-phosphate uridylyltransferase; ASD, ADP-sugar diphosphatase; STP, starch phosphorylase; GPA, glucose-1-phosphate adenylyltransferase; STS, starch synthase; GOP, glycogen operon protein; α-AMY, α-amylase; β-AMY, β-amylase; α-GLU, α-glucosidase.
Figure 8
Figure 8. The expression pattern of genes involved in citrate cycle.
Enzyme names, unigene ids and expression patterns are indicated on each step. The y-axis represents average read_count value of each library. Study sites: PYC, acetyl-CoA C-acetyltransferase; MDH, malate dehydrogenase; FH, fumarate hydratase; SDH/α-SCS, succinate dehydrogenase/succinyl-CoA synthetase alpha subunit; DST/β-SCS, dihydrolipoamide succinyltransferase/succinyl-CoA synthetase beta subunit; DLST, dihydrolipoamide succinyltransferase; OGDH, 2-oxoglutarate dehydrogenase E1 component; IDH, isocitrate dehydrogenase; ACH, aconitate hydratase; CS, citrate synthase; ACL, ATP citrate (pro-S)-lyase.
Figure 9
Figure 9. The expression pattern of genes involved in the ubiquitin mediated proteolysis pathway and MADS-box transcript factors.
(A) The relative expression of up- and down-regulated genes of ubiquitin conjugating enzyme. (B) The expression pattern of DEGs of ubiquitin conjugating enzyme. (C) The relative expression of up-regulated and down-regulated genes of ubiquitin protein ligase. (D) The expression pattern of DEGs of ubiquitin protein ligase. (E) The relative expression of up- and down-regulated genes of MADS-box transcript factors. (F) The expression pattern of DEGs of MADS-box transcript factors. Black fonts indicate the up-regulated gene ID. The asterisk (*) indicates that the gene is satisfied the differentially expression analysis criteria (padj < 0.05 and log2 (fold change) ≥ 1 or log2 (fold change) ≤ −1) in the corresponding comparative combination.

References

    1. Aharoni A, De Vos CH, Wein M, Sun Z, Greco R, Kroon A, Mol JN, O’Connell AP. The strawberry FaMYB1 transcription factor suppresses anthocyanin and flavonol accumulation in transgenic tobacco. Plant Journal. 2001;28(3):319–332. doi: 10.1046/j.1365-313x.2001.01154.x. - DOI - PubMed
    1. Allan AC, Hellens RP, Laing WA. MYB transcription factors that colour our fruit. Trends in Plant Science. 2008;13(3):99–102. doi: 10.1016/j.tplants.2007.11.012. - DOI - PubMed
    1. Almeida JR, D’Amico E, Preuss A, Carbone F, de Vos CH, Deiml B, Mourgues F, Perrotta G, Fischer TC, Bovy AG, Martens S, Rosati C. Characterization of major enzymes and genes involved in flavonoid and proanthocyanidin biosynthesis during fruit development in strawberry (Fragaria × ananassa) Archives of Biochemistry and Biophysics. 2007;465(1):61–71. doi: 10.1016/j.abb.2007.04.040. - DOI - PubMed
    1. Anders S, Huber W. Differential expression analysis for sequence count data. Genome Biology. 2010;11(10):R106. doi: 10.1186/gb-2010-11-10-r106. - DOI - PMC - PubMed
    1. Benjamini Y, Hochberg Y. Controlling the false discovery rate—a practical and powerful approach to multiple testing. Journal of the Royal Statistical Society. Series B (Methodological) 1995;57(1):289–300.

LinkOut - more resources