

Pathway analysis identifies altered mitochondrial metabolism, neurotransmission, structural pathways and complement cascade in retina/RPE/ choroid in chick model of form-deprivation myopia
- PMID: 29967729
- PMCID: PMC6026464
- DOI: 10.7717/peerj.5048
Pathway analysis identifies altered mitochondrial metabolism, neurotransmission, structural pathways and complement cascade in retina/RPE/ choroid in chick model of form-deprivation myopia
Abstract
Purpose: RNA sequencing analysis has demonstrated bidirectional changes in metabolism, structural and immune pathways during early induction of defocus induced myopia. Thus, the aim of this study was to investigate whether similar gene pathways are also related to the more excessive axial growth, ultrastructural and elemental microanalytic changes seen during the induction and recovery from form-deprivation myopia (FDM) in chicks and predicted by the RIDE model of myopia.
Methods: Archived genomic transcriptome data from the first three days of induction of monocularly occluded form deprived myopia (FDMI) in chicks was obtained from the GEO database (accession # GSE6543) while data from chicks monocularly occluded for 10 days and then given up to 24 h of normal visual recovery (FDMR) were collected. Gene set enrichment analysis (GSEA) software was used to determine enriched pathways during the induction (FDMI) and recovery (FDMR) from FD. Curated gene-sets were obtained from open access sources.
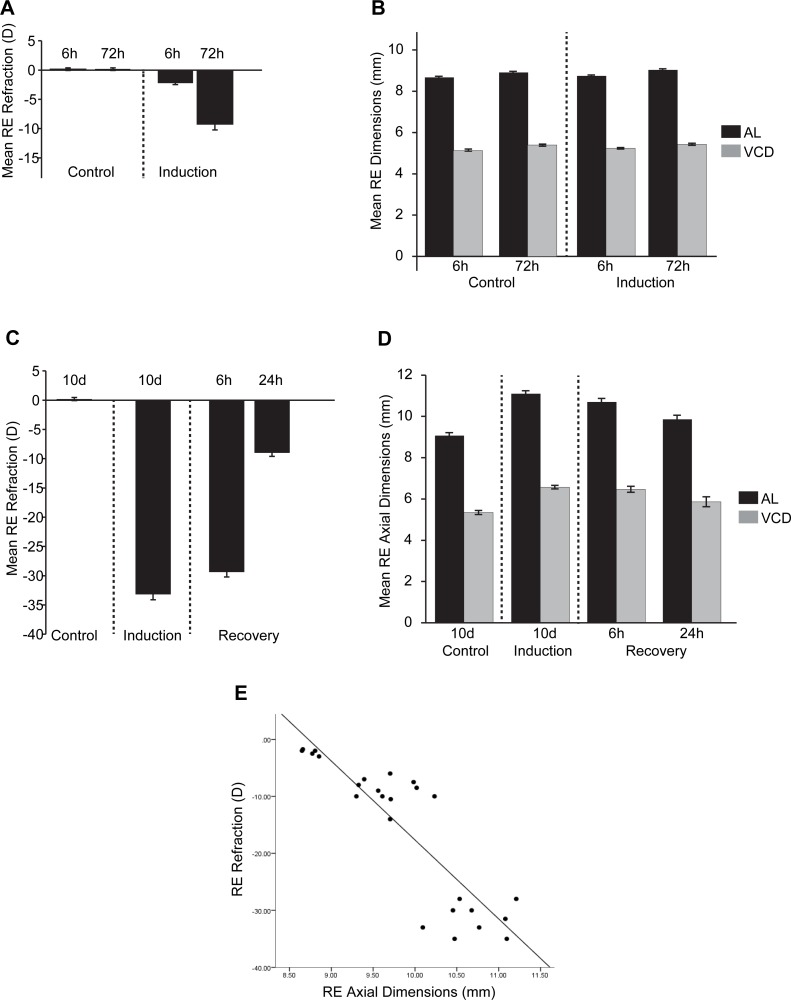
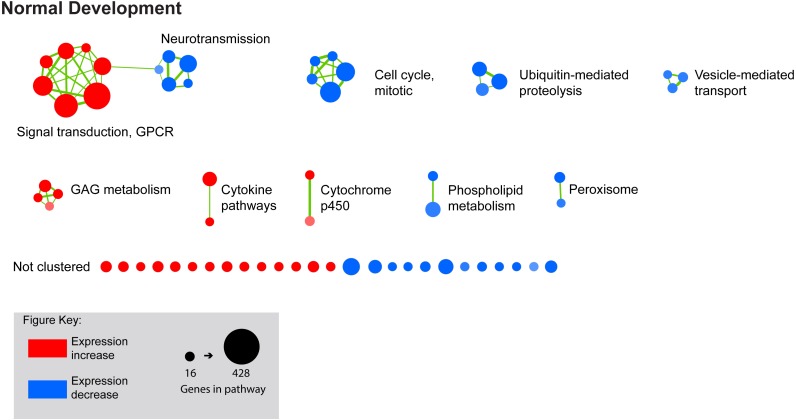
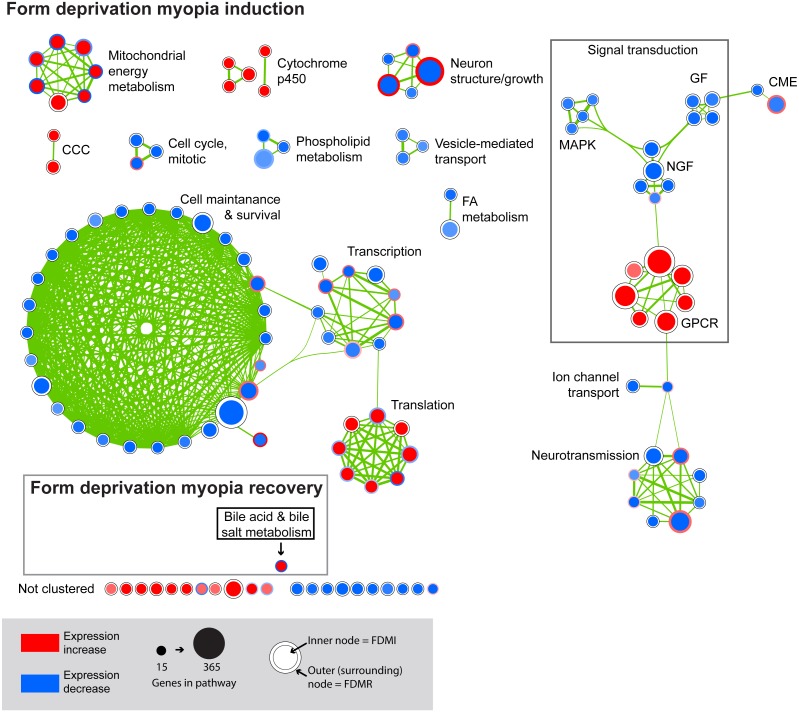
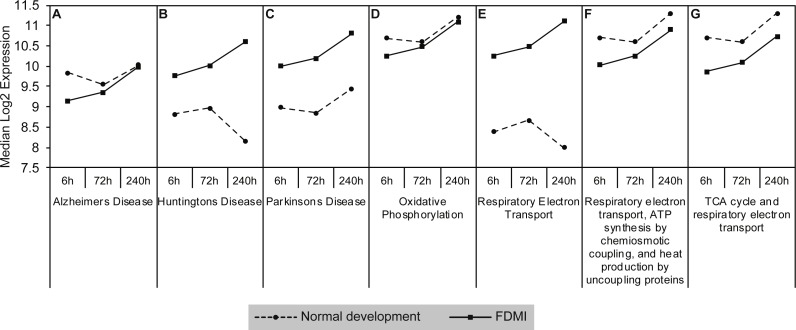
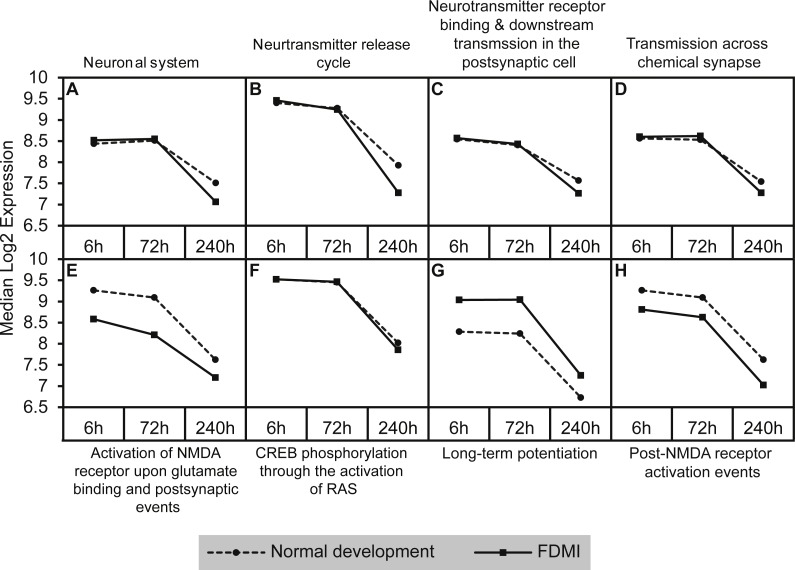
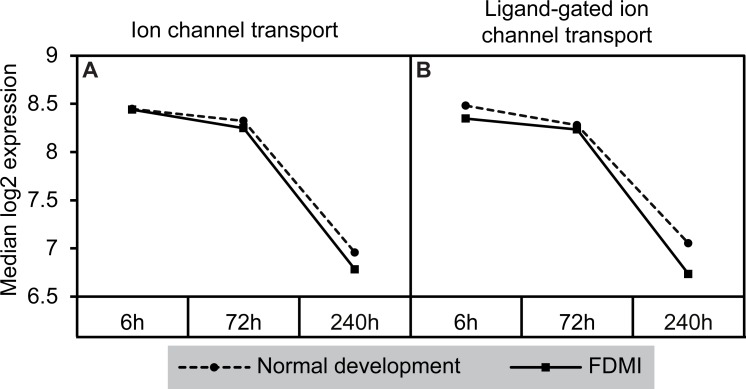
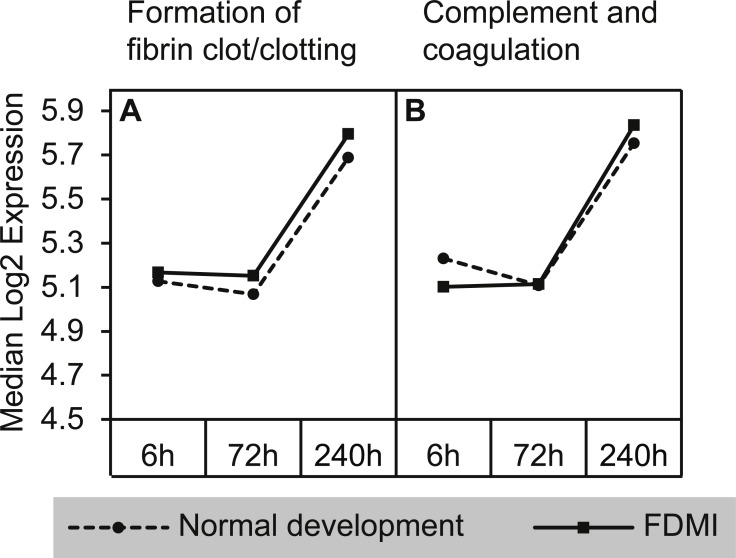
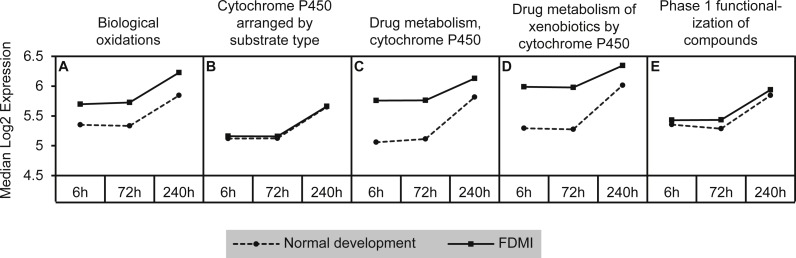
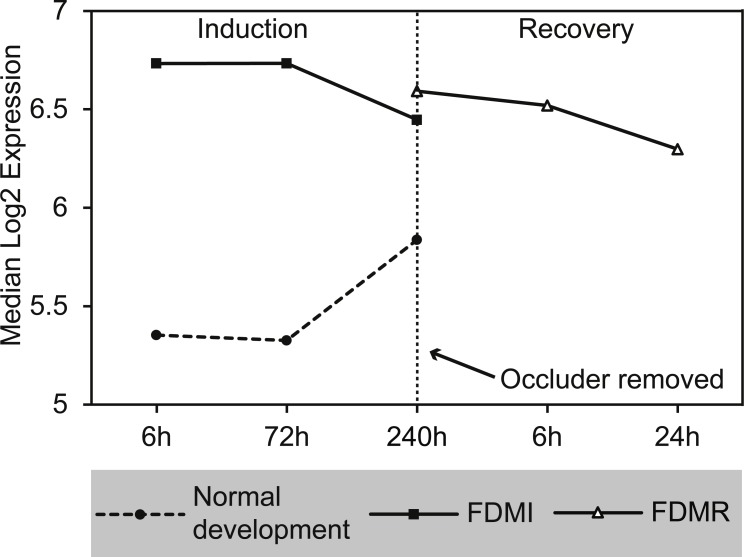
Results: Clusters of significant changes in mitochondrial energy metabolism, neurotransmission, ion channel transport, G protein coupled receptor signalling, complement cascades and neuron structure and growth were identified during the 10 days of induction of profound myopia and were found to correlate well with change in axial dimensions. Bile acid and bile salt metabolism pathways (cholesterol/lipid metabolism and sodium channel activation) were significantly upregulated during the first 24 h of recovery from 10 days of FDM.
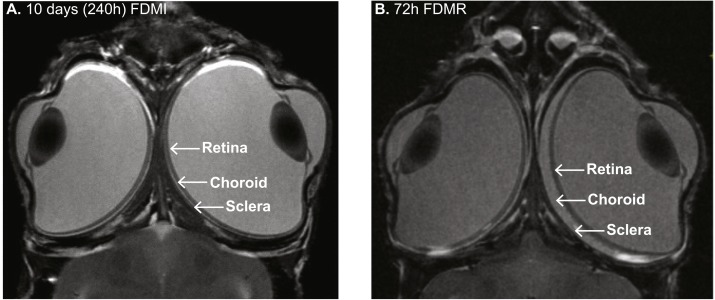
Conclusions: The gene pathways altered during induction of FDM are similar to those reported in defocus induced myopia and are established indicators of oxidative stress, osmoregulatory and associated structural changes. These findings are also consistent with the choroidal thinning, axial elongation and hyperosmotic ion distribution patterns across the retina and choroid previously reported in FDM and predicted by RIDE.
Keywords: Bile acid metabolism; Gene set enrichment analysis; Mitochondrial energy metabolism; Myopia; Neurotransmission.
Conflict of interest statement
The authors declare there are no competing interests.
Figures
Similar articles
-
RNA-seq and GSEA identifies suppression of ligand-gated chloride efflux channels as the major gene pathway contributing to form deprivation myopia.Sci Rep. 2021 Mar 5;11(1):5280. doi: 10.1038/s41598-021-84338-y. Sci Rep. 2021. PMID: 33674625 Free PMC article.
-
Short term optical defocus perturbs normal developmental shifts in retina/RPE protein abundance.BMC Dev Biol. 2018 Aug 29;18(1):18. doi: 10.1186/s12861-018-0177-1. BMC Dev Biol. 2018. PMID: 30157773 Free PMC article.
-
A role for aquaporin-4 during induction of form deprivation myopia in chick.Mol Vis. 2008 Feb 8;14:298-307. Mol Vis. 2008. PMID: 18334967 Free PMC article.
-
The retina/RPE proteome in chick myopia and hyperopia models: Commonalities with inherited and age-related ocular pathologies.Mol Vis. 2017 Dec 5;23:872-888. eCollection 2017. Mol Vis. 2017. PMID: 29259393 Free PMC article.
-
Structural and elemental evidence for edema in the retina, retinal pigment epithelium, and choroid during recovery from experimentally induced myopia.Invest Ophthalmol Vis Sci. 2004 Aug;45(8):2463-74. doi: 10.1167/iovs.03-1009. Invest Ophthalmol Vis Sci. 2004. PMID: 15277465
Cited by
-
Higher Intraocular Levels of Inflammatory Factors are Related to Retinal Vascular and Neurodegeneration in Myopic Retinopathy.J Inflamm Res. 2024 Dec 11;17:10889-10900. doi: 10.2147/JIR.S484338. eCollection 2024. J Inflamm Res. 2024. PMID: 39677296 Free PMC article.
-
RNA-Sequencing Analysis Reveals the Role of Mitochondrial Energy Metabolism Alterations and Immune Cell Activation in Form-Deprivation and Lens-Induced Myopia in Mice.Genes (Basel). 2023 Nov 30;14(12):2163. doi: 10.3390/genes14122163. Genes (Basel). 2023. PMID: 38136985 Free PMC article.
-
RNA-Seq Analysis Reveals an Essential Role of the Tyrosine Metabolic Pathway and Inflammation in Myopia-Induced Retinal Degeneration in Guinea Pigs.Int J Mol Sci. 2021 Nov 22;22(22):12598. doi: 10.3390/ijms222212598. Int J Mol Sci. 2021. PMID: 34830490 Free PMC article.
-
Single-cell RNA sequencing of retina revealed novel transcriptional landscape in high myopia and underlying cell-type-specific mechanisms.MedComm (2020). 2023 Sep 20;4(5):e372. doi: 10.1002/mco2.372. eCollection 2023 Oct. MedComm (2020). 2023. PMID: 37746666 Free PMC article.
-
Integrative Transcriptome and Proteome Analyses Elucidate the Mechanism of Lens-Induced Myopia in Mice.Invest Ophthalmol Vis Sci. 2023 Oct 3;64(13):15. doi: 10.1167/iovs.64.13.15. Invest Ophthalmol Vis Sci. 2023. PMID: 37819745 Free PMC article.
References
-
- Affymetrix . Affymetrix, Inc; Santa Clara: 2004.
-
- Affymetrix Affymetrix Expression Console™ Software. Version 1.0—User Guidehttp://www.affymetrix.com/support/downloads/manuals/expression_console_u... 2006
-
- Andreola F, Fernandez-Salguero PM, Chiantore MV, Petkovich MP, Gonzalez FJ, De Luca LM. Aryl hydrocarbon receptor knockout mice (AHR-/-) exhibit liver retinoid accumulation and reduced retinoic acid metabolism. Cancer Research. 1997;57:2835–2838. - PubMed
LinkOut - more resources
Full Text Sources
Other Literature Sources
Molecular Biology Databases
