. 2018 Jun 26:6:e5145.
doi: 10.7717/peerj.5145. eCollection 2018.

Huperzine A attenuates nonalcoholic fatty liver disease by regulating hepatocyte senescence and apoptosis: an in vitro study

Affiliations

Huperzine A attenuates nonalcoholic fatty liver disease by regulating hepatocyte senescence and apoptosis: an in vitro study

Xiao-Na Hu et al. PeerJ. .

Abstract

Objective: This study was undertaken to detect if free fatty acids (FFA) induce hepatocyte senescence in L-02 cells and if huperzine A has an anti-aging effect in fatty liver cells.

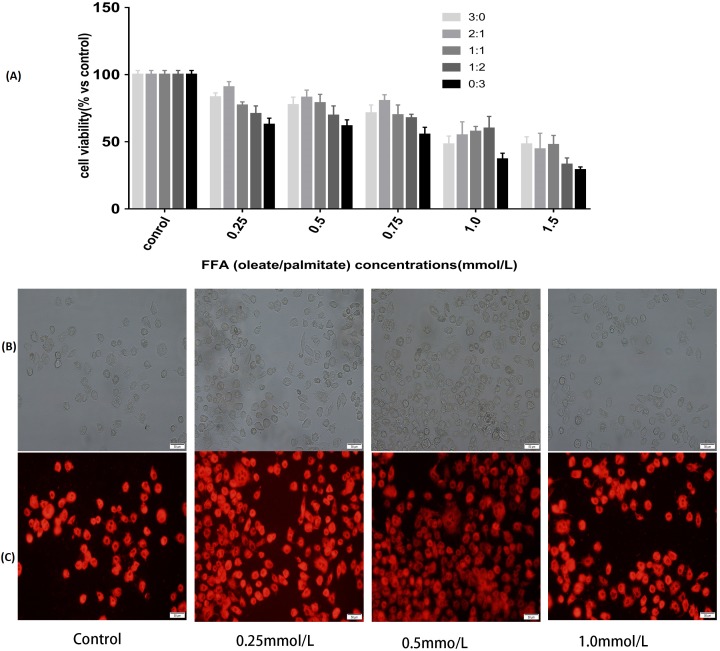
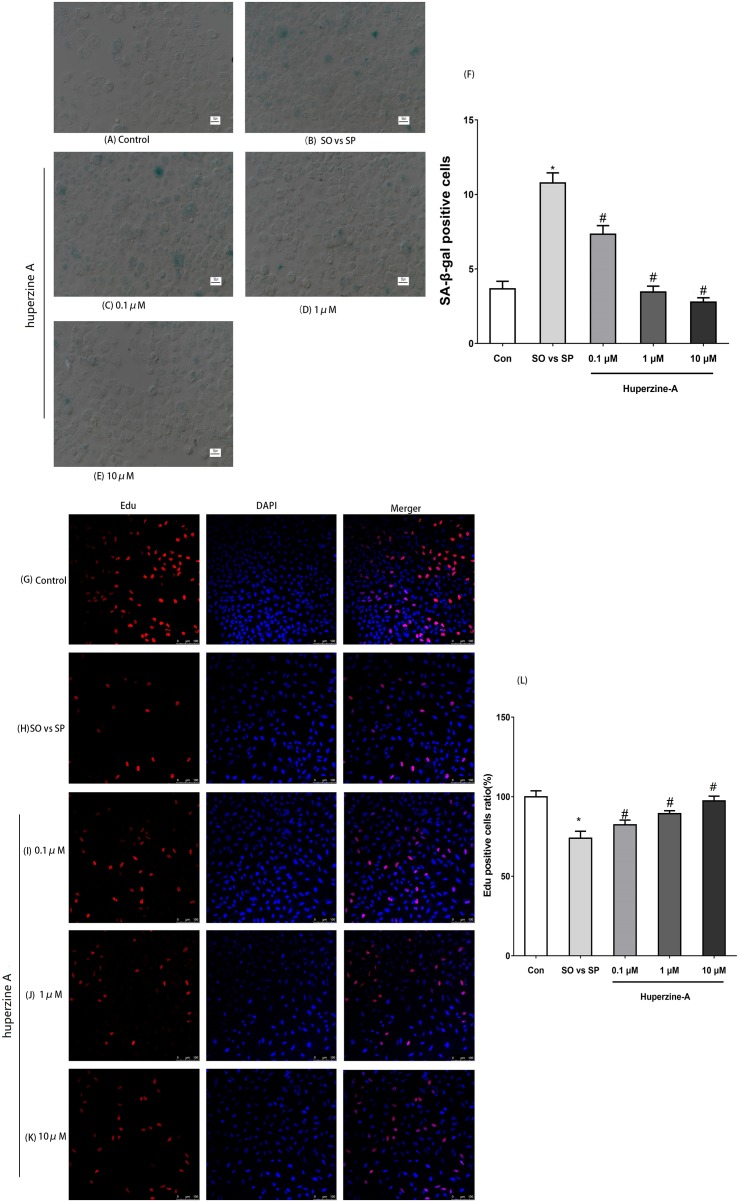
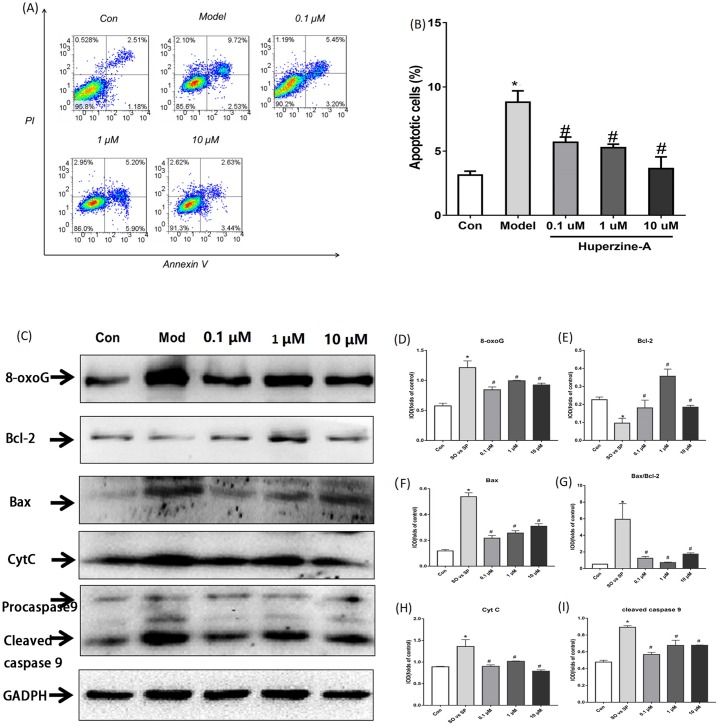
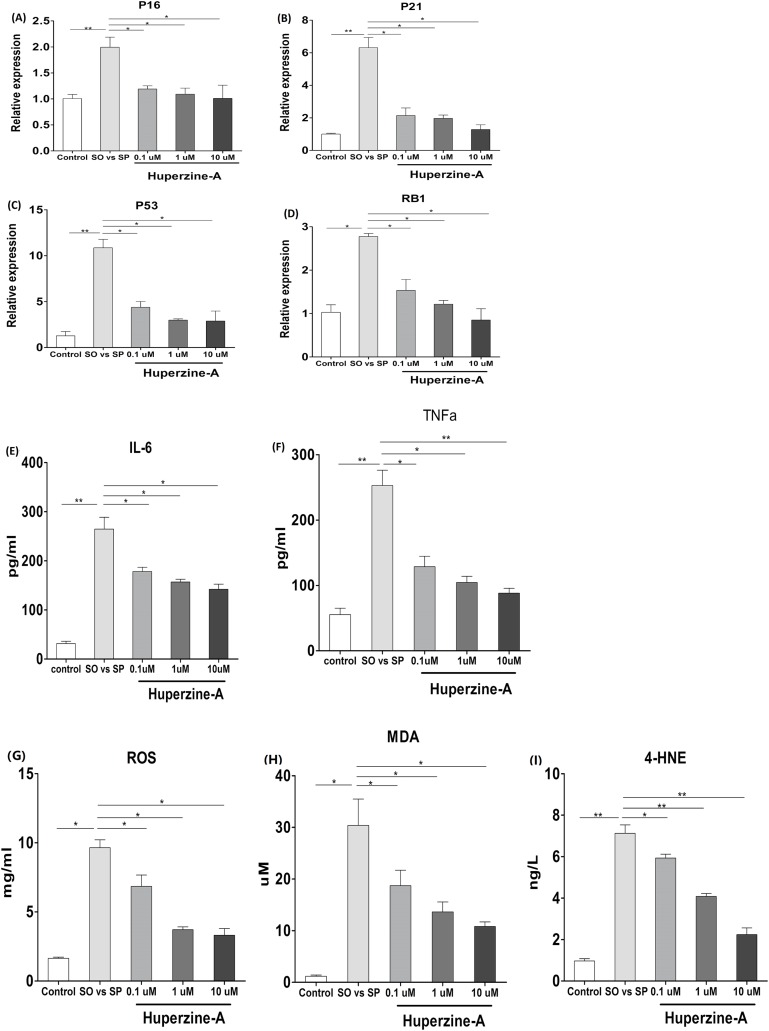
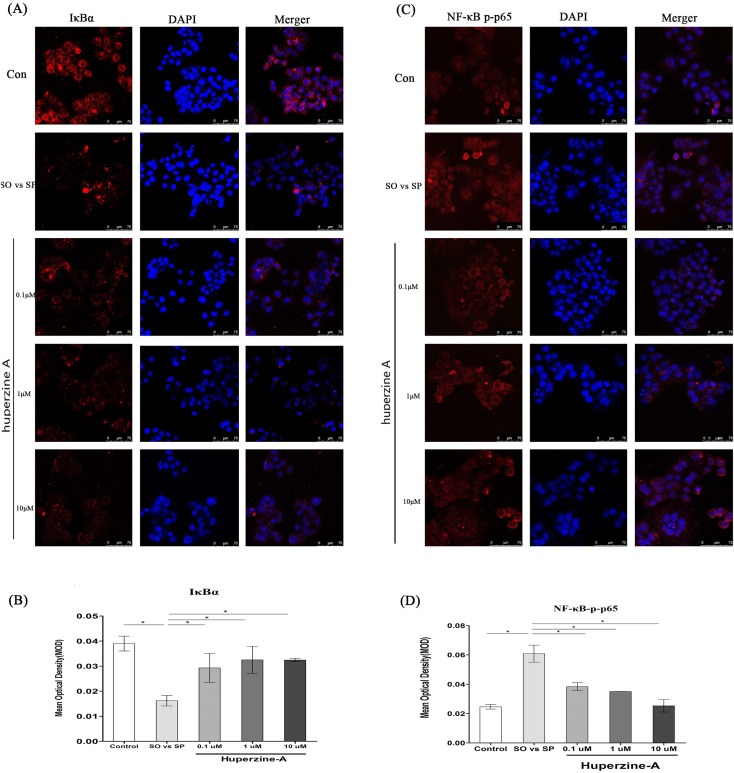
Methods: L-02 cells were treated with a FFA mixture (oleate/palmitate, at 3:0, 2:1, 1:1, 1:2 and 0:3 ratios) at different concentrations. Cell viability and fat accumulation rate were assessed by a Cell Counting Kit 8 and Nile Red staining, respectively. The mixture with the highest cell viability and fat accumulation rate was selected to continue with the following experiment. The L-02 cells were divided into five groups, including the control group, FFA group, FFA + 0.1 μmol/L huperzine A (LH) group, FFA + 1.0 μmol/L huperzine A (MH) group and FFA + 10 μmol/L huperzine A (HH) group, and were cultured for 24 h. The expression of senescence-associated β-galactosidase (SA-β-gal) was detected by an SA-β-gal staining kit. The expression levels of aging genes were measured by qRT-PCR. The expression levels of apoptosis proteins were detected by a Western blot. ELISA kits were used to detect inflammatory factors and oxidative stress products. The expression of nuclear factor (NF-κB) and IκBα were detected by immunofluorescence.

Results: The FFA mixture (oleate/palmitate, at a 2:1 ratio) of 0.5 mmol/L had the highest cell viability and fat accumulation rate, which was preferable for establishing an in vitro fatty liver model. The expression of inflammatory factors (TNF-α and IL-6) and oxidants Malonaldehyde (MDA), 4-hydroxynonenal (HNE) and reactive oxygen species (ROS) also increased in the L-02 fatty liver cells. The expression levels of aging markers and aging genes, such as SA-β-gal, p16, p21, p53 and pRb, increased more in the L-02 fatty liver cells than in the L-02 cells. The total levels of the apoptosis-associated proteins Bcl2, Bax, Bax/Bcl-2, CyCt and cleaved caspase 9 were also upregulated in the L-02 fatty liver cells. All of the above genes and proteins were downregulated in the huperzine A and FFA co-treatment group. In the L-02 fatty liver cells, the expression of IκBα decreased, while the expression of NF-κB increased. After the huperzine A and FFA co-treatment, the expression of IκBα increased, while the expression of NF-κB decreased.

Conclusion: Fatty liver cells showed an obvious senescence and apoptosis phenomenon. Huperzine A suppressed hepatocyte senescence, and it might exert its anti-aging effect via the NF-κB pathway.

Keywords: Apoptosis; Hepatocyte senescence; Huperzine A; Nonalcoholic fatty liver disease.


Conflict of interest statement

The authors declare that they have no competing interests.

Figures

Figure 1
Figure 1. Effects of FFA on cell viability and lipids accumulation in L-02 cells.
(A) L-02 cells were treated with FFA mixture at various ratios (oleate/palmitate at 3:0, 2:1, 1:1, 1:2 and 0:3 ratio) and concentrations (0.25, 0.5, 0.75, 1.0 and 1.5 mmol/L) for 24 h. Cell viability was determined by a Cell Counting Kit 8 (CCK8) kit. The viability of the L-02 cells incubated with FFA mixed at a ratio of 2:1 (oleate/palmitate) was higher than that for the other ratios in FFA lower than 1.0 mmol/L groups (P < 0.05). The viability of the L-02 cells incubated with 0.25, 0.5, 0.75 and 1.0 mmol/L of the FFA mixture (oleate/palmitate) were all higher than those incubated with 1.5 mmol/L of the FFA mixture (P < 0.05). (B) The white light microscopic image of lipid dropets. (C) The fluorescent microscopic image of lipid dropts (dyed red in Nile Red staining). The FFA mixture of 0.5 mmol/L with sodium oleate and sodium palmitate mixed a ratio of 2:1 had higher lipid accumulation rate (P < 0.05).
Figure 2
Figure 2. The expression of SA-β-gal and Edu by immunofluorescence labeling.
(A–F) L-02 cells were treated with FFA, FFA + LH, FFA + MH and FFA + HH for 24 h. The expression of SA-β-gal determined by immunofluorescence labeling. Quantitative analysis of SA-β-gal-positive cells in the five groups by the ratio of SA-β-gal-positive cell number to the total and normalized to the controls. The expression of the SA-β-gal-positive cells was nearly threefold in the FFA group compared with in the control group (P < 0.01), but reversed in the FFA + LH, FFA + MH and FFA + HH groups (P < 0.01). (G–L) The expression of Edu was detected by immunofluorescence labeling. Quantitative analysis of Edu-positive cells in the five groups by the ratio of Edu-positive cell number to the total and normalized to the controls. The expression of Edu in the FFA group was lower than in the control group (P < 0.01). The expression levels were all higher in FFA + LH, FFA + MH and FFA + HH groups than in the FFA group (P < 0.01), but with no significant difference among FFA + LH, FFA + MH and FFA + HH groups (P > 0.05). Data presented as the mean ± SE (n = 3 independent replicates). *P < 0.05 vs. control; #P < 0.05 vs. FFA models; FFA mixture: 0.5 mmol/L, sodium oleate (SO)/sodium palmitate (SP) mixed at a 2:1 ratio; LH: FFA + 0.1 μmol/L huperzine A; MH:FFA + 1.0 μmol/L huperzine A; HH:FFA + 10 μmol/L huperzine A.
Figure 3
Figure 3. Cell apoptosis and the expression of apoptosis proteins determined by flow cytometry and Western Blot.
(A and B) L-02 cells were treated with FFA, FFA + LH, FFA + MH and FFA + HH for 24 h and stained with Annexin V-fluorescein isothiocyanate (FITC) and propidium iodide. Apoptotic and necrotic cells were monitored by flow cytometry. The percentage of apoptotic cells was higher in FFA group than in the controls (P < 0.01). The percentage of apoptotic cells in LH, MH and HH groups were lower than in the FFA group (P < 0.05). (C–I) The expression of apoptosis proteins was determined by Western Blot. The total protein levels of 8-oxoG, Bax, Bax/Bcl2, CytC and cleaved caspase 9 were upregulated in the FFA group compared with the levels in the control group (P < 0.01). They were decreased in the FFA + LH, FFA + MH and FFA + HH groups compared with those of the FFA group (P < 0.01), but with no significant difference among FFA + LH, FFA + MH and FFA + HH groups (P > 0.05). Data presented as the mean ± SE (n = 3 independent replicates). *P < 0.01 vs. control; #P < 0.01 vs. FFA models; FFA mixture: 0.5 mmol/L, sodium oleate (SO)/sodium palmitate (SP) mixed at a 2:1 ratio; LH: FFA + 0.1 μmol/L huperzine A; MH: FFA + 1.0 μmol/L huperzine A; HH: FFA + 10 μmol/L huperzine A.
Figure 4
Figure 4. The expression of senescence genes, inflamm-aging factors and oxidative stress.
(A–D) L-02 cells were treated with FFA, FFA + LH, FFA + MH and FFA + HH for 24 h and then the expression of p16, p21, p53 and pRb were determined by qRT-PCR. The expression of p16, p21, p53 and pRb in the FFA group was higher than in the control group (P < 0.01). All of the mRNA levels of above aging genes in the FFA + LH, FFA + MH and FFA + HH groups were decreased compared with those in the FFA group (P < 0.01). (E–F) The protein levels of TNF-α and IL-6 were detected by ELISA. The protein levels of TNF-α and IL-6 in the FFA group were higher than in the control group (P < 0.01). They were decreased in the FFA + LH, FFA + MH and FFA + HH groups compared with those in the FFA group (P < 0.01), but with no significant difference among FFA + LH, FFA + MH and FFA + HH groups (P > 0.05). (G–I) The expression of MDA, 4-HNE and ROS were determined by ELISA. The levels of MDA, 4-HNE and ROS were increased in the FFA group compared with those in the control group (P < 0.01), and they decreased in the FFA + LH, FFA + MH and FFA + HH groups compared with those in the FFA group (P < 0.01). In addition, they decreased with increasing huperzine A concentrations (P < 0.05). Data presented as the mean ± SE (n = 3 independent replicates). FFA mixture: 0.5 mmol/L, sodium oleate (SO)/sodium palmitate (SP) mixed at a 2:1 ratio; LH: FFA + 0.1 μmol/L huperzine A; MH: FFA + 1.0 μmol/L huperzine A; HH: FFA + 10 μmol/L huperzine A.
Figure 5
Figure 5. The expression of NF-κB and IκBa.
(A) L-02 cells were treated with FFA, FFA + LH, FFA + MH and FFA + HH for 24 h. The expression of IκBa was determined by immunofluorescence assay. (B) The mean optical density (MOD) value of IκBα. It was decreased in the FFA group compared with that of the control group (P < 0.01), but increased in the FFA + LH, FFA + MH and FFA + HH groups compared with that in the FFA group (P < 0.01). (C) The expression of NF-κB p-p65 was determined by immunofluorescence assay. (D) The MOD value of NF-κB-p-p65. It was higher in the FFA group than in the control group, but was inversed in the FFA + LH, FFA + MH and FFA + HH groups than in theFFA group (P < 0.01). Data presented as the mean ± SE (n = 3 independent replicates). FFA mixture: 0.5 mmol/L, sodium oleate (SO)/sodium palmitate (SP) mixed at a 2:1 ratio; LH: FFA + 0.1 μmol/L huperzine A; MH: FFA + 1.0 μmol/L huperzine A; HH: FFA + 10 μmol/L huperzine A.

Similar articles

Cited by

References

    1. Aravinthan A, Scarpini C, Tachtatzis P, Verma S, Penrhyn-Lowe S, Harvey R, Davies SE, Allison M, Coleman N, Alexander G. Hepatocyte senescence predicts progression in non-alcohol-related fatty liver disease. Journal of Hepatology. 2013;58(3):549–556. doi: 10.1016/j.jhep.2012.10.031. - DOI - PubMed
    1. Bai J, Cederbaum AI. Cycloheximide protects HepG2 cells from serum withdrawal-induced apoptosis by decreasing p53 and phosphorylated p53 levels. Journal of Pharmacology and Experimental Therapeutics. 2006;319(3):1435–1443. doi: 10.1124/jpet.106.110007. - DOI - PubMed
    1. Bertolotti M, Lonardo A, Mussi C, Baldelli E, Pellegrini E, Ballestri S, Romagnoli D, Loria P. Nonalcoholic fatty liver disease and aging: epidemiology to management. World Journal of Gastroenterology. 2014;20(39):14185–14204. doi: 10.3748/wjg.v20.i39.14185. - DOI - PMC - PubMed
    1. Brenner T, Nizri E, Irony-Tur-Sinai M, Hamra-Amitay Y, Wirguin I. Acetylcholinesterase inhibitors and cholinergic modulation in Myasthenia Gravis and neuroinflammation. Journal of Neuroimmunology. 2008;201–202:121–127. doi: 10.1016/j.jneuroim.2008.05.022. - DOI - PubMed
    1. Brown JP, Wei W, Sedivy JM. Bypass of senescence after disruption of p21CIP1/WAF1 gene in normal diploid human fibroblasts. Science. 1997;277(5327):831–834. doi: 10.1126/science.277.5327.831. - DOI - PubMed

LinkOut - more resources