. 2018 Oct;80(7):1804-1822.
doi: 10.3758/s13414-018-1552-5.

Task and distribution sampling affect auditory category learning

Affiliations

Task and distribution sampling affect auditory category learning

Casey L Roark et al. Atten Percept Psychophys. 2018 Oct.

Abstract

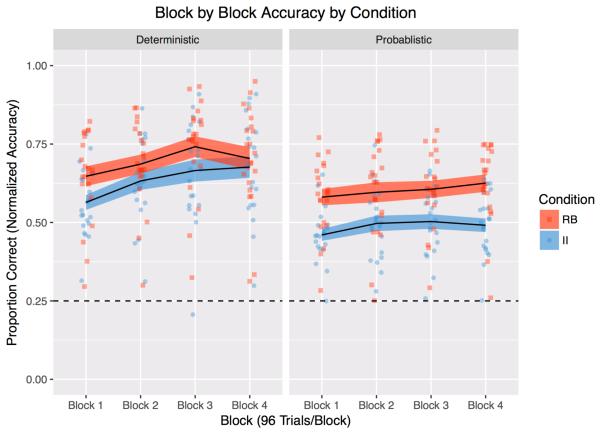
There is substantial evidence that two distinct learning systems are engaged in category learning. One is principally engaged when learning requires selective attention to a single dimension (rule-based), and the other is drawn online by categories requiring integration across two or more dimensions (information-integration). This distinction has largely been drawn from studies of visual categories learned via overt category decisions and explicit feedback. Recent research has extended this model to auditory categories, the nature of which introduces new questions for research. With the present experiment, we addressed the influences of incidental versus overt training and category distribution sampling on learning information-integration and rule-based auditory categories. The results demonstrate that the training task influences category learning, with overt feedback generally outperforming incidental feedback. Additionally, distribution sampling (probabilistic or deterministic) and category type (information-integration or rule-based) both affect how well participants are able to learn. Specifically, rule-based categories are learned equivalently, regardless of distribution sampling, whereas information-integration categories are learned better with deterministic than with probabilistic sampling. The interactions of distribution sampling, category type, and kind of feedback impacted category-learning performance, but these interactions have not yet been integrated into existing category-learning models. These results suggest new dimensions for understanding category learning, inspired by the real-world properties of auditory categories.

Keywords: Audition; Categorization; Perceptual learning.


Conflict of interest statement

The authors have no conflicts of interest to declare.

Figures

Figure 1.
Figure 1.
Stimulus distributions. a) Rule-Based, Deterministic b) Information-Integration, Deterministic. c) Rule-Based, Probabilistic d) Information-Integration Probabilistic.
Figure 2.
Figure 2.
Outline of tasks used in the current experiment. a) Incidental training task b) Overt training task.
Figure 3.
Figure 3.
Average reaction time during the Incidental training task. Ribbon error bars represent the standard error of the mean. Individual points represent individual participant averages. Participants in the II condition are shown as blue circles and participants in the RB condition are shown as red squares.
Figure 4.
Figure 4.
Block-by-block performance during the Overt training task. The dotted line denotes chance performance (25%). Ribbon error bars represent the standard error of the mean. Individual points represent individual participant averages. Performance for participants in the II condition is shown in blue circles and performance for the RB condition is shown in red squares.
Figure 5.
Figure 5.
Generalization test performance for all conditions. The dotted line denotes chance performance (25%). Error bars represent the standard error of the mean. Individual points represent individual participant average.
Figure 6.
Figure 6.
Confusion matrices for information-integration conditions in the generalization test. Each column represents the actual category identity of the exemplars played on a trial and each row represents the category response that the participant made. The shading gradient and percentages within each cell represent how frequently participants gave a particular response for each category. Columns sum to 100%. To the right is a schematic diagram of the information-integration category structures (also shown in Figure 2).
Figure 7.
Figure 7.
Confusion matrices for rule-based conditions in the generalization test. Each column represents the actual category identity of the exemplars played on a trial and each row represents the category response that the participant made. The shading gradient and percentages within each cell represent how frequently participants gave a particular response for each category. Columns sum to 100%. To the right is a schematic diagram of the rule-based category structures (also shown in Figure 2).

Similar articles

Cited by

References

    1. Ashby FG, Alfonso-Reese LA, Turken AU, & Waldron EM (1998). A neuropsychological theory of multiple systems in category learning. Psychological Review, 105(3), 442–481. 10.1037/0033-295X.105.3.442 - DOI - PubMed
    1. Ashby FG, & Gott RE (1988). Decision rules in the perception and categorization of multidimensional stimuli. Journal of Experimental Psychology: Learning, Memory, and Cognition, 14(1), 33–53. 10.1037//0278-7393.14.1.33 - DOI - PubMed
    1. Ashby FG, & Maddox WT (2011). Human category learning 2.0. Annals of the New York Academy of Sciences, 1224, 147–61. 10.1111/j.1749-6632.2010.05874.x - DOI - PMC - PubMed
    1. Ashby FG, Maddox WT, & Bohil CJ (2002). Observational versus feedback training in rule-based and information-integration category learning. Memory & Cognition, 30(5), 666–677. 10.3758/BF03196423 - DOI - PubMed
    1. Ashby FG, & O’Brien JB (2007). The effects of positive versus negative feedback on information-integration category learning. Perception & Psychophysics, 69(6), 865–878. 10.3758/BF03193923 - DOI - PubMed

LinkOut - more resources