

Increased optical pathlength through aqueous media for the infrared microanalysis of live cells
- PMID: 29968104
- PMCID: PMC6096700
- DOI: 10.1007/s00216-018-1188-2
Increased optical pathlength through aqueous media for the infrared microanalysis of live cells
Abstract
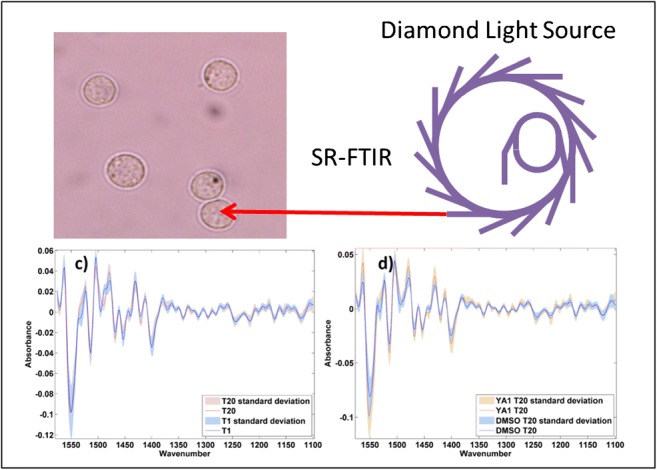
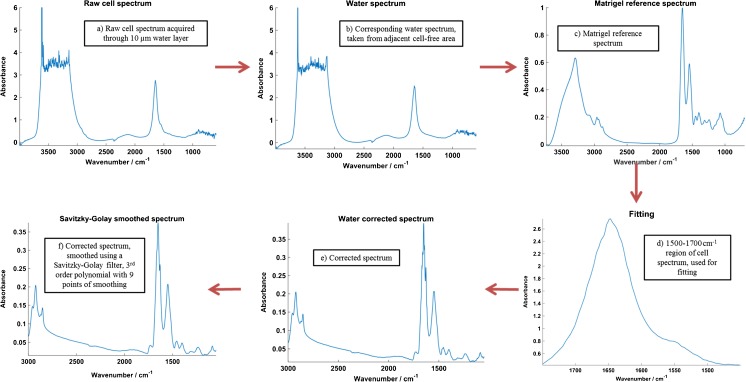
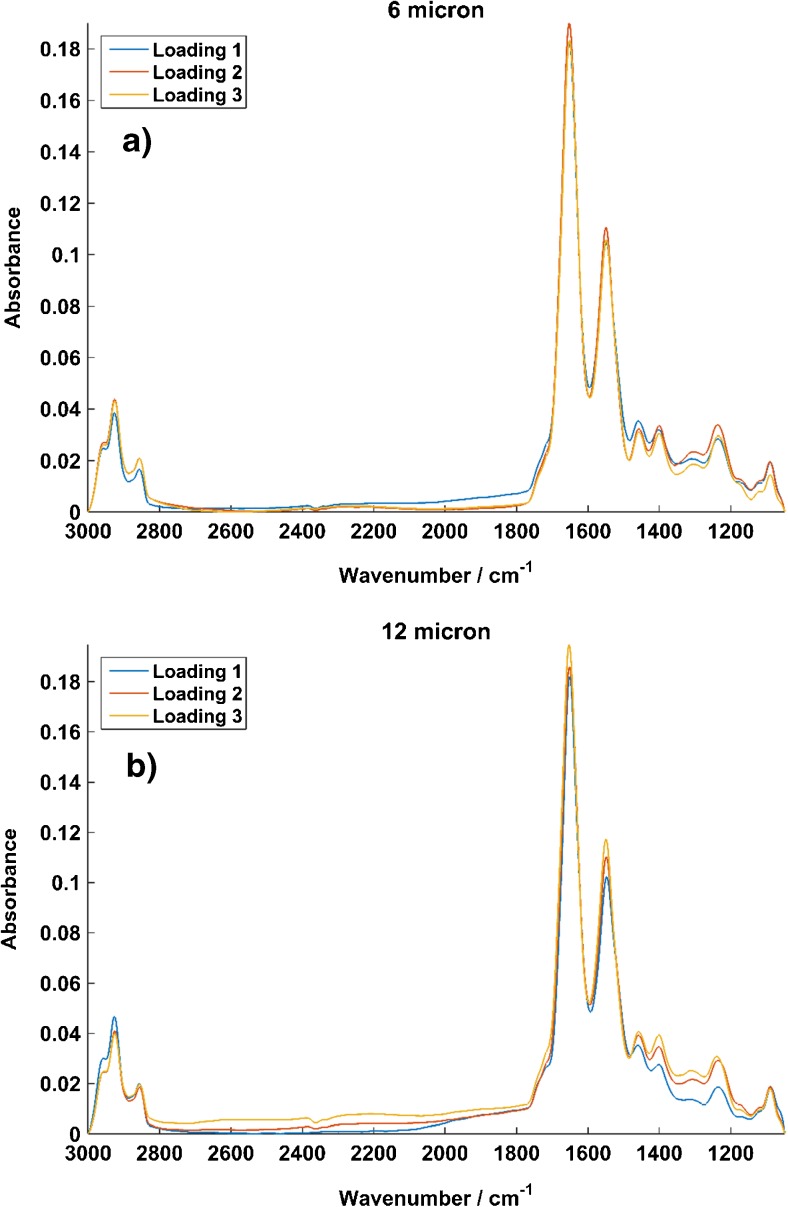
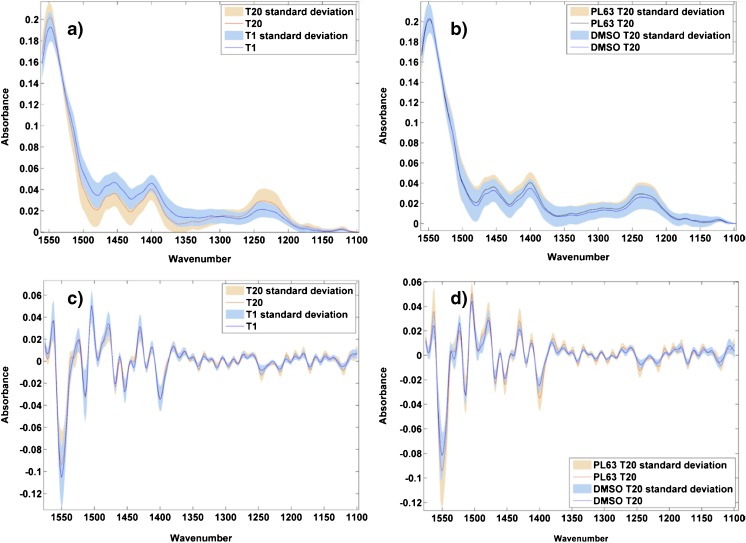
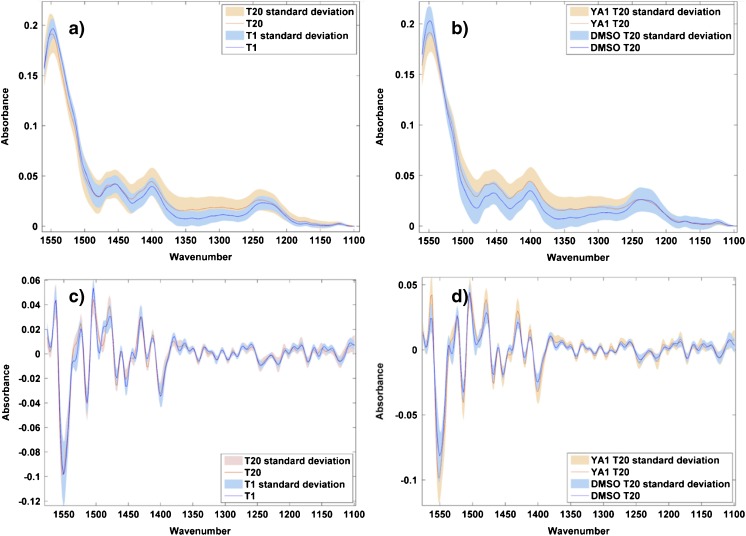
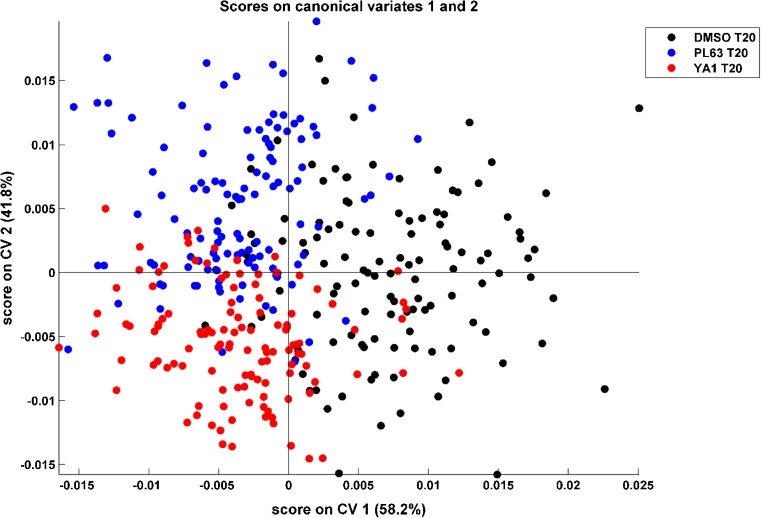
The study of live cells using Fourier transform infrared spectroscopy (FTIR) and FTIR microspectroscopy (FT-IRMS) intrinsically yields more information about cell metabolism than comparable experiments using dried or chemically fixed samples. There are, however, a number of barriers to obtaining high-quality vibrational spectra of live cells, including correction for the significant contributions of water bands to the spectra, and the physical stresses placed upon cells by compression in short pathlength sample holders. In this study, we present a water correction method that is able to result in good-quality cell spectra from water layers of 10 and 12 μm and demonstrate that sufficient biological detail is retained to separate spectra of live cells based upon their exposure to different novel anti-cancer agents. The IR brilliance of a synchrotron radiation (SR) source overcomes the problem of the strong water absorption and provides cell spectra with good signal-to-noise ratio for further analysis. Supervised multivariate analysis (MVA) and investigation of average spectra have shown significant separation between control cells and cells treated with the DNA cross-linker PL63 on the basis of phosphate and DNA-related signatures. Meanwhile, the same control cells can be significantly distinguished from cells treated with the protein kinase inhibitor YA1 based on changes in the amide II region. Each of these separations can be linked directly to the known biochemical mode of action of each agent. Graphical abstract.
Keywords: Cancer; Drug-cell interactions; Fourier transform infrared spectroscopy (FTIR); Infrared microspectroscopy (IRMS); Single cell; Synchrotron radiation (SR).
Conflict of interest statement
The authors declare that they have no conflict of interest.
Figures
Similar articles
-
Synchrotron FTIR analysis of drug treated ovarian A2780 cells: an ability to differentiate cell response to different drugs?Analyst. 2011 Feb 7;136(3):498-507. doi: 10.1039/c0an00564a. Epub 2010 Nov 18. Analyst. 2011. PMID: 21088767
-
Live single cell analysis using synchrotron FTIR microspectroscopy: development of a simple dynamic flow system for prolonged sample viability.Analyst. 2019 Jan 28;144(3):997-1007. doi: 10.1039/c8an01566j. Analyst. 2019. PMID: 30403210
-
Shedding light on biochemical changes in single neuron-like pheochromocytoma cells following exposure to synchrotron sourced terahertz radiation using synchrotron source Fourier transform infrared microspectroscopy.J Synchrotron Radiat. 2025 Jan 1;32(Pt 1):155-161. doi: 10.1107/S1600577524010944. Epub 2025 Jan 1. J Synchrotron Radiat. 2025. PMID: 39692724 Free PMC article.
-
Facing the challenge of biosample imaging by FTIR with a synchrotron radiation source.J Synchrotron Radiat. 2010 Jan;17(1):1-11. doi: 10.1107/S0909049509046056. Epub 2009 Dec 22. J Synchrotron Radiat. 2010. PMID: 20029106 Review.
-
Biomedical investigations using Fourier transform-infrared microspectroscopy.Crit Rev Anal Chem. 2014;44(3):270-6. doi: 10.1080/10408347.2013.829389. Crit Rev Anal Chem. 2014. PMID: 25391565 Review.
Cited by
-
Identifying the Responses from the Estrogen Receptor-Expressed MCF7 Cells Treated in Anticancer Drugs of Different Modes of Action Using Live-Cell FTIR Spectroscopy.ACS Omega. 2020 May 22;5(22):12698-12706. doi: 10.1021/acsomega.9b04369. eCollection 2020 Jun 9. ACS Omega. 2020. PMID: 32548453 Free PMC article.
-
Analysis of Fixed and Live Single Cells Using Optical Photothermal Infrared with Concomitant Raman Spectroscopy.Anal Chem. 2021 Mar 2;93(8):3938-3950. doi: 10.1021/acs.analchem.0c04846. Epub 2021 Feb 17. Anal Chem. 2021. PMID: 33595297 Free PMC article.
-
Benchtop IR Imaging of Live Cells: Monitoring the Total Mass of Biomolecules in Single Cells.Anal Chem. 2024 Sep 17;96(37):14783-14790. doi: 10.1021/acs.analchem.4c02108. Epub 2024 Sep 4. Anal Chem. 2024. PMID: 39230511 Free PMC article.
-
Vibrational Spectroscopy for Identification of Metabolites in Biologic Samples.Molecules. 2020 Oct 15;25(20):4725. doi: 10.3390/molecules25204725. Molecules. 2020. PMID: 33076318 Free PMC article. Review.
-
Implementation of multiomic mass spectrometry approaches for the evaluation of human health following environmental exposure.Mol Omics. 2024 Jun 10;20(5):296-321. doi: 10.1039/d3mo00214d. Mol Omics. 2024. PMID: 38623720 Free PMC article. Review.
References
MeSH terms
Substances
Grants and funding
LinkOut - more resources
Full Text Sources
Other Literature Sources
Research Materials
