. 2018 Nov;9(11):945-965.
doi: 10.1007/s13238-018-0560-5. Epub 2018 Jul 2.

CRISPR/Cas9-mediated gene knockout reveals a guardian role of NF-κB/RelA in maintaining the homeostasis of human vascular cells

Affiliations

CRISPR/Cas9-mediated gene knockout reveals a guardian role of NF-κB/RelA in maintaining the homeostasis of human vascular cells

Ping Wang et al. Protein Cell. 2018 Nov.

Erratum in

Abstract

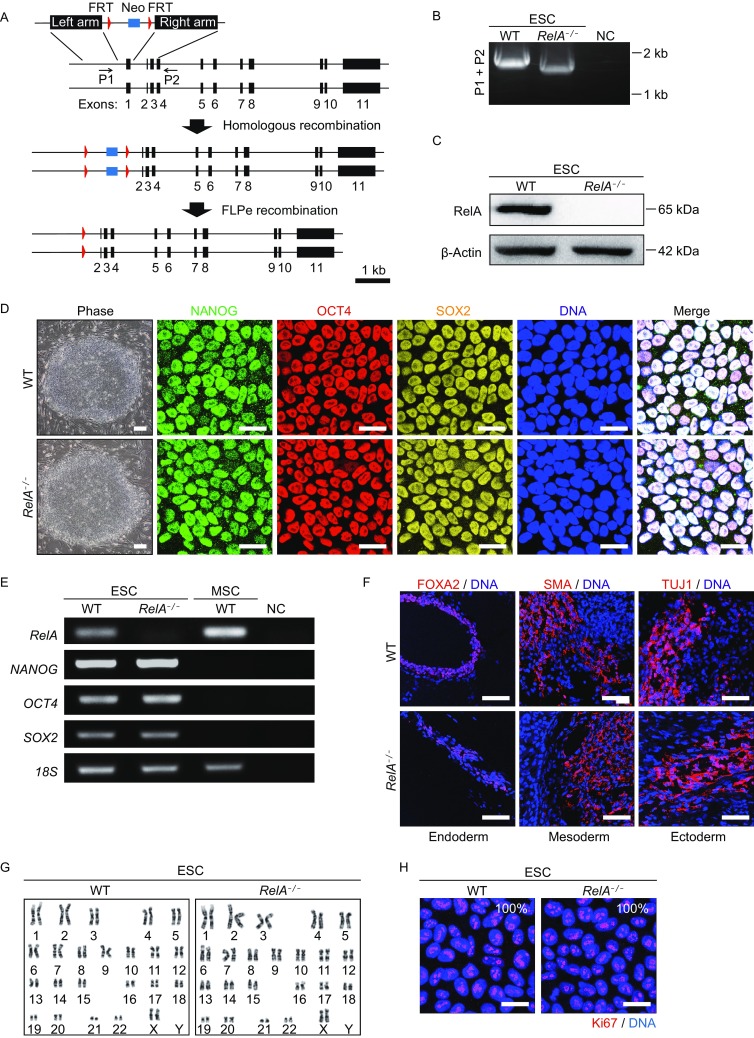
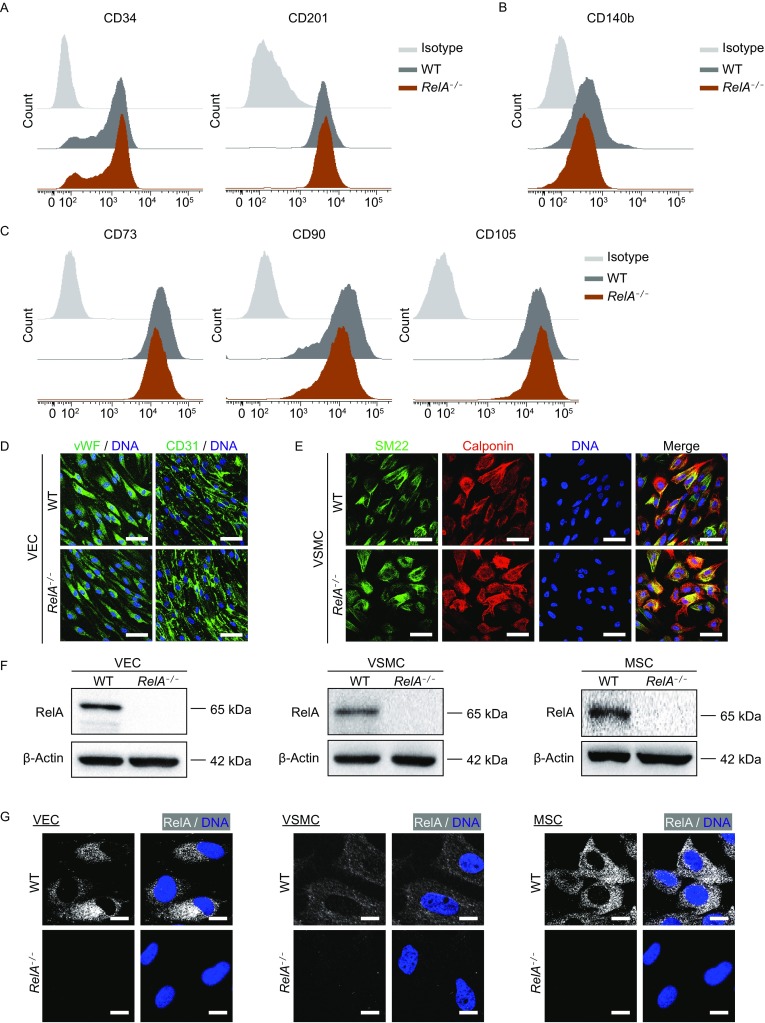
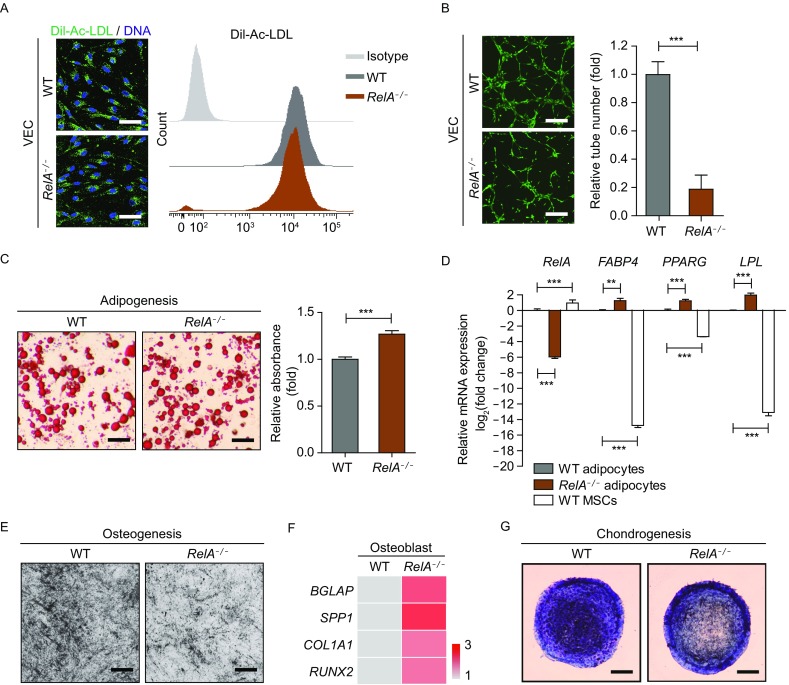
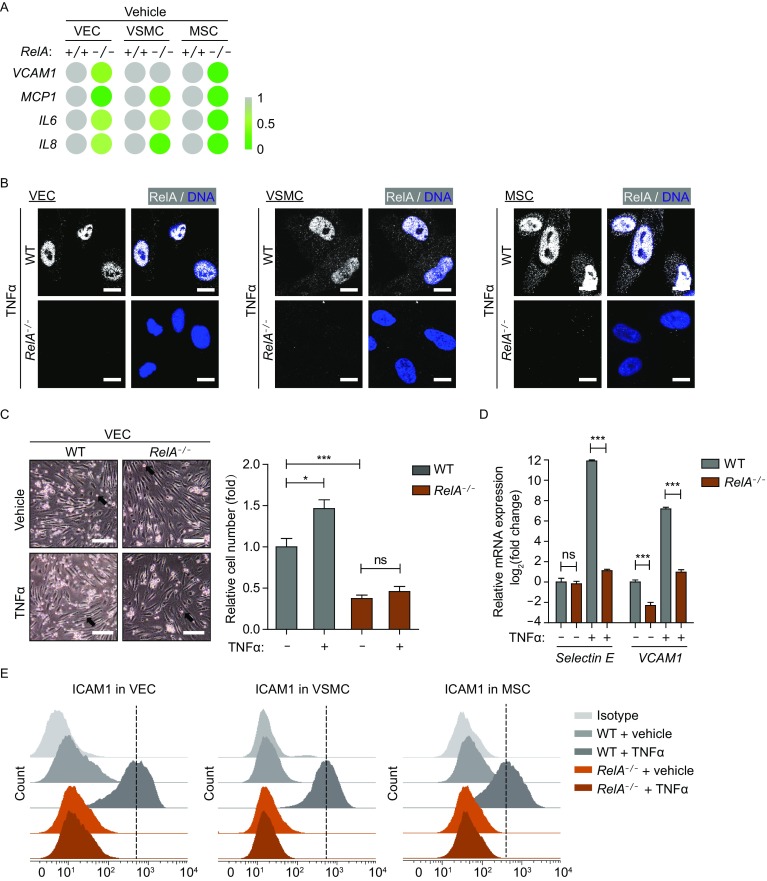
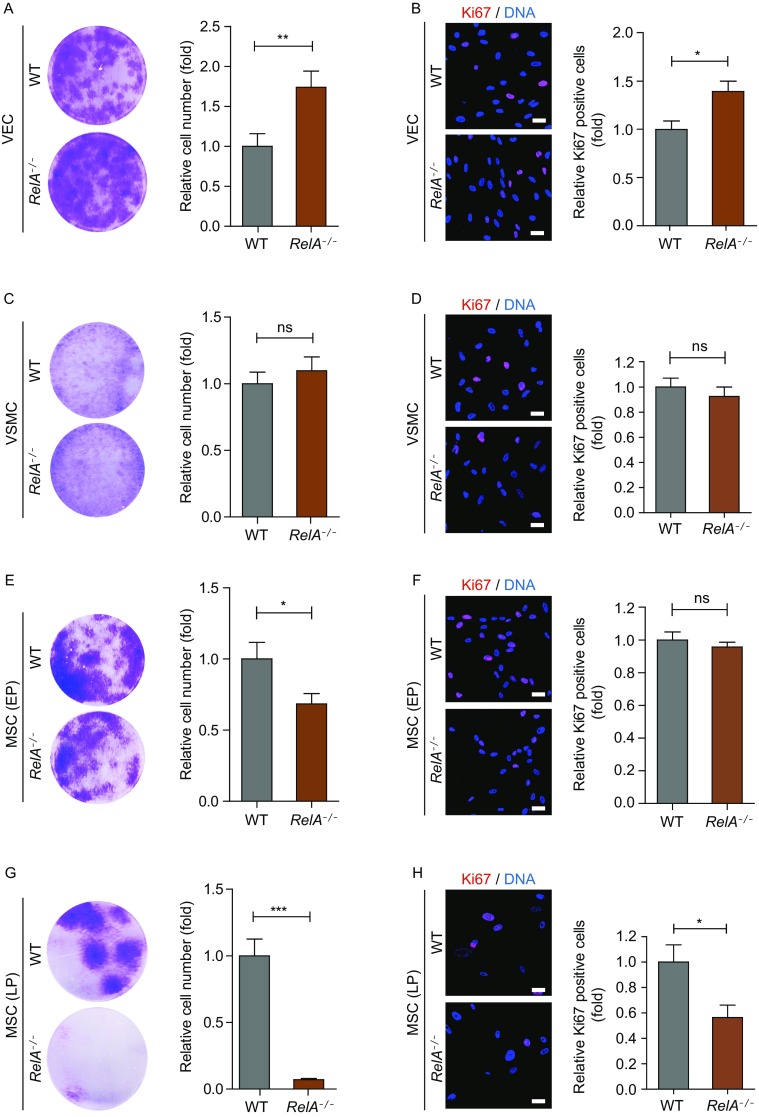
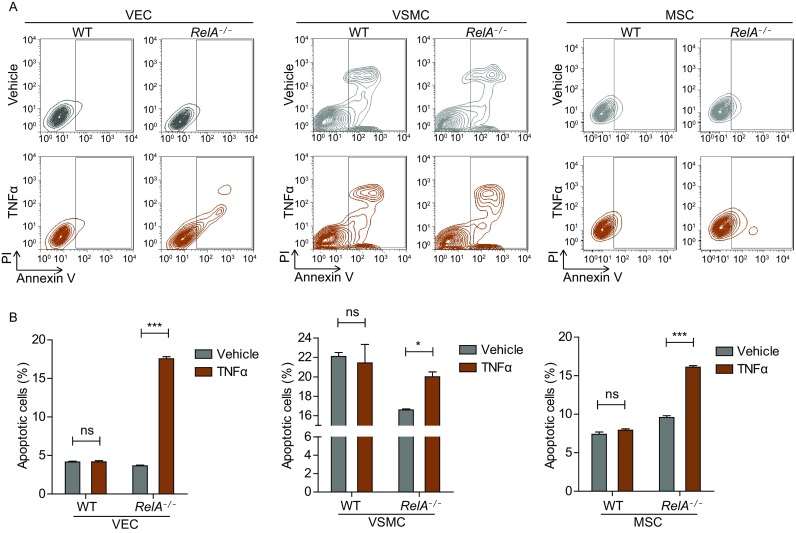
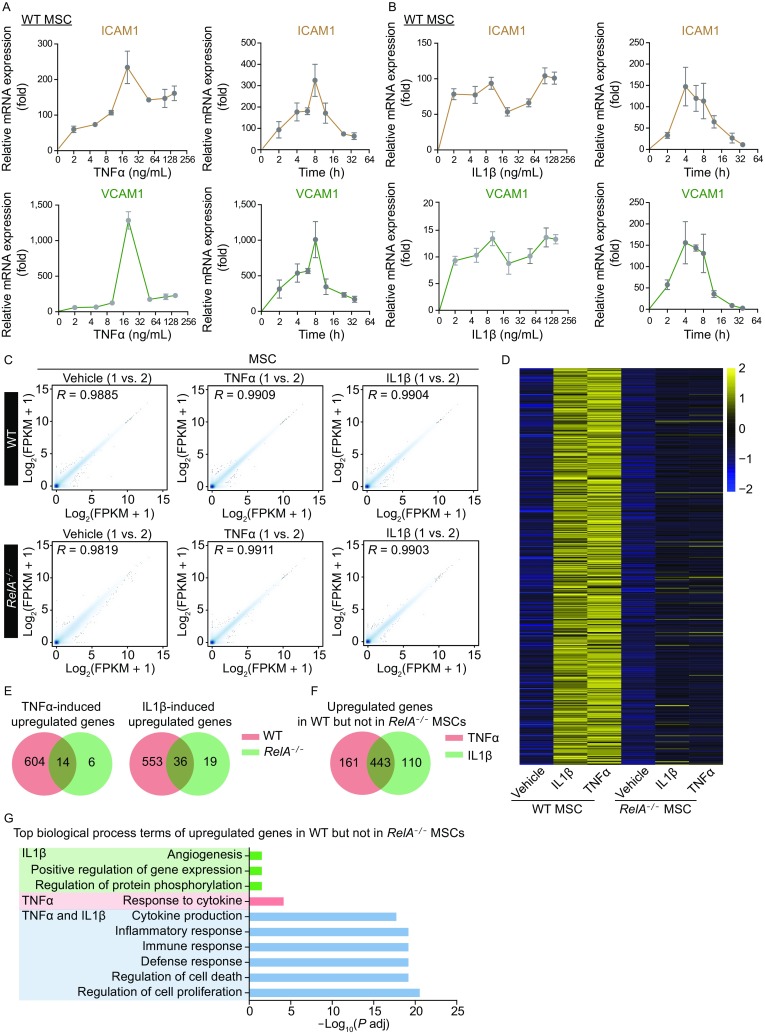
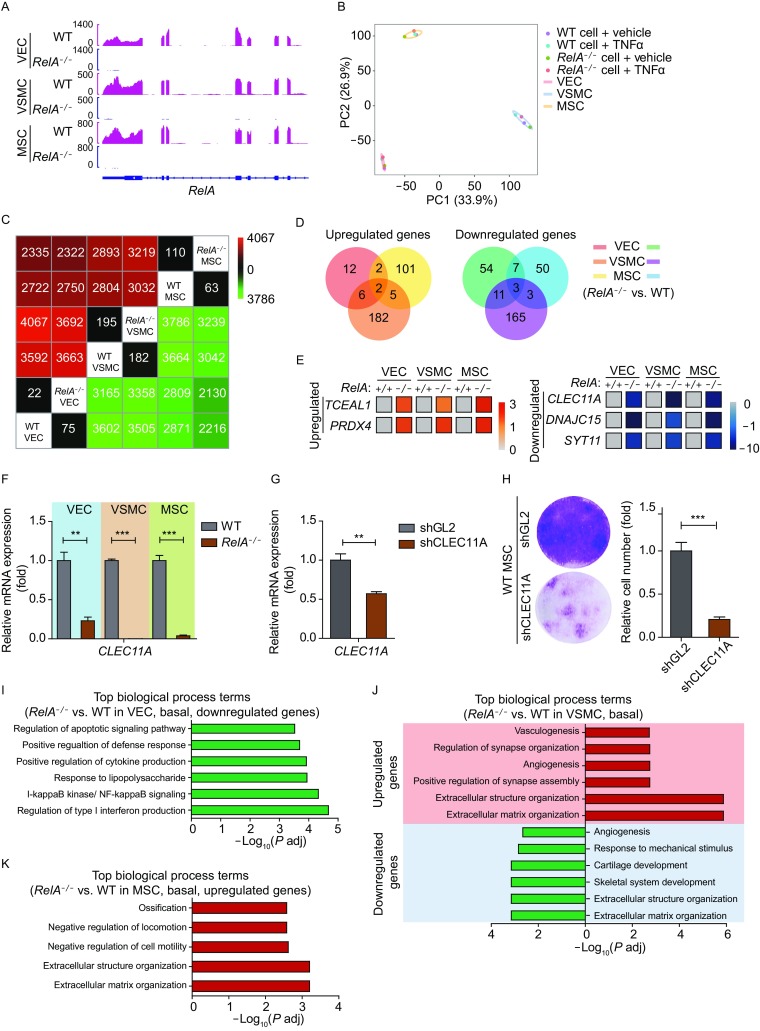
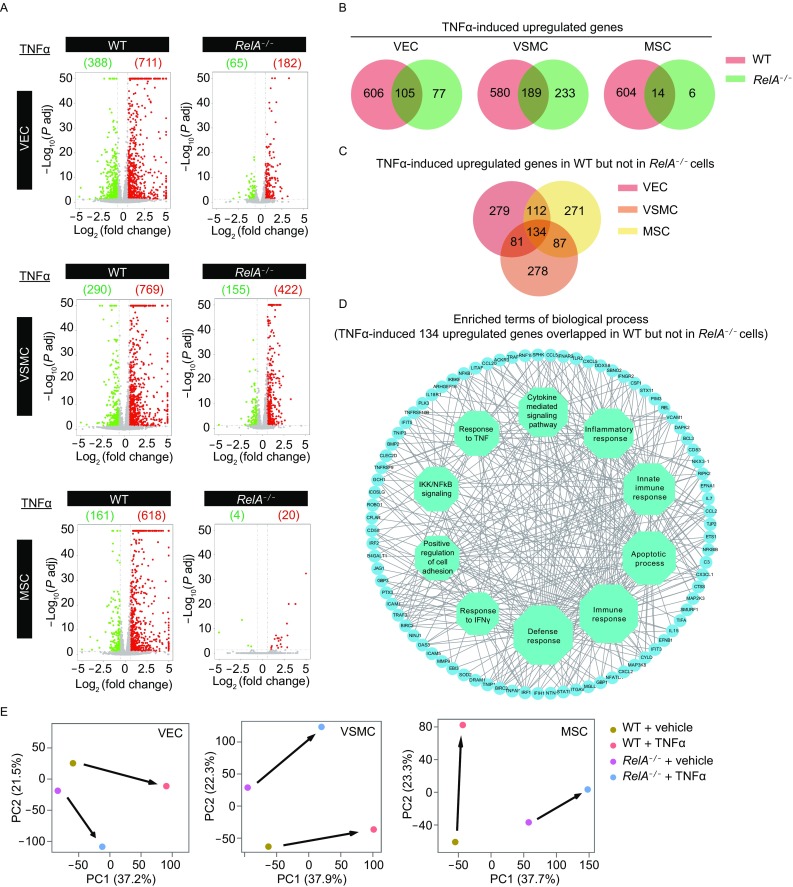
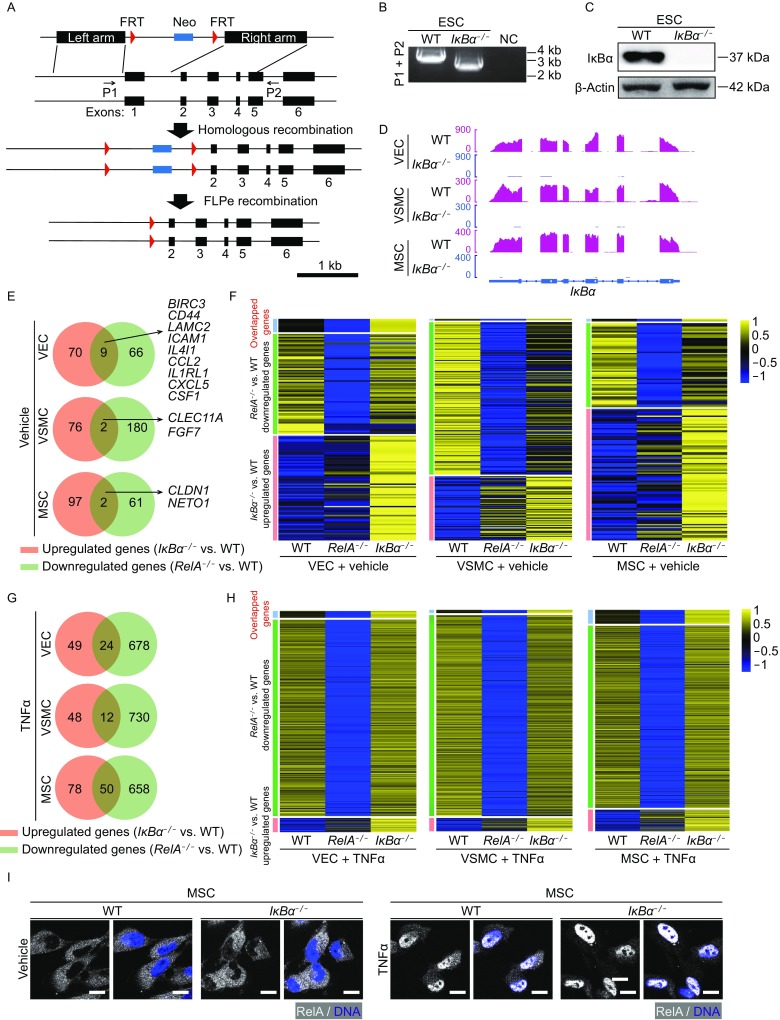
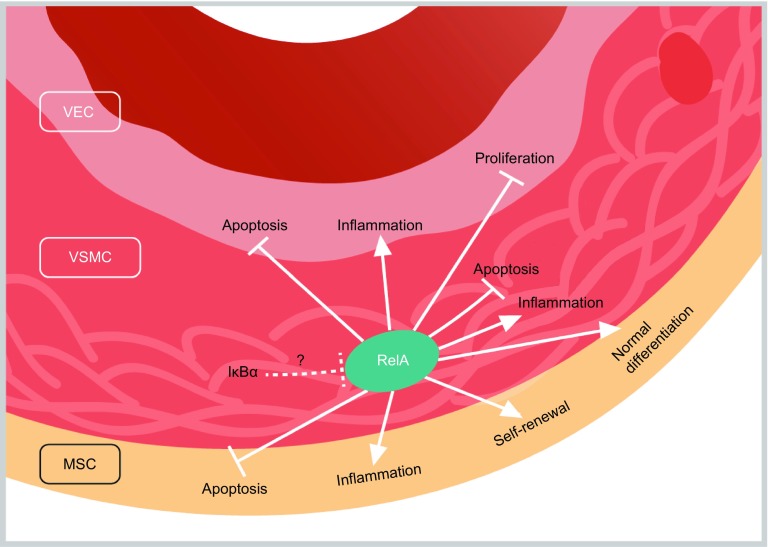
Vascular cell functionality is critical to blood vessel homeostasis. Constitutive NF-κB activation in vascular cells results in chronic vascular inflammation, leading to various cardiovascular diseases. However, how NF-κB regulates human blood vessel homeostasis remains largely elusive. Here, using CRISPR/Cas9-mediated gene editing, we generated RelA knockout human embryonic stem cells (hESCs) and differentiated them into various vascular cell derivatives to study how NF-κB modulates human vascular cells under basal and inflammatory conditions. Multi-dimensional phenotypic assessments and transcriptomic analyses revealed that RelA deficiency affected vascular cells via modulating inflammation, survival, vasculogenesis, cell differentiation and extracellular matrix organization in a cell type-specific manner under basal condition, and that RelA protected vascular cells against apoptosis and modulated vascular inflammatory response upon tumor necrosis factor α (TNFα) stimulation. Lastly, further evaluation of gene expression patterns in IκBα knockout vascular cells demonstrated that IκBα acted largely independent of RelA signaling. Taken together, our data reveal a protective role of NF-κB/RelA in modulating human blood vessel homeostasis and map the human vascular transcriptomic landscapes for the discovery of novel therapeutic targets.

Keywords: Apoptosis; Inflammation; NF-κB; RelA; Stem cell.


Figures

Figure 1
Figure 1
Generation and characterization of RelA−/− human ESCs. (A) Schemic diagram of RelA knockout strategy via CRISPR/Cas9 in human ESCs. A neomycin-resistant cassette (Neo) was included for positive selection. (B) Genomic PCR verification of RelA exon 1 knockout in RelA−/− ESCs. Water was used as a negative control (NC). (C) Western blot analysis of RelA protein levels in WT and RelA−/− ESCs. β-Actin was used as a loading control. (D) Representative colony morphology and immunostaining of pluripotency markers in WT and RelA−/− ESCs. Scale bar, 30 μm. (E) Measurement of the mRNA expression levels of pluripotency markers by semi-quantitative PCR in WT and RelA−/− ESCs. 18S was used as a loading control. (F) Teratoma analysis of WT and RelA−/− ESCs with three germ layer markers. Markers were stained in red; DNA was labeled in blue by Hoechst 33342. Scale bar, 100 μm. (G) Karyotype analysis of WT and RelA−/− ESCs. (H) Ki67 immunostaining in WT and RelA−/− ESCs. Ki67 was stained in red; DNA was labeled by Hoechst 33342. Scale bar, 30 μm
Figure 2
Figure 2
Derivation of RelA−/− VECs, VSMCs, and MSCs from RelA−/− ESCs. (A) Flow cytometric analysis of WT and RelA−/− VECs with VEC-specific markers CD34 and CD201. IgG-FITC and IgG-PE were used as isotype controls. (B) Flow cytometric analysis of WT and RelA−/− VSMCs with VSMC-specific marker, CD140b. IgG-APC was used as an isotype control. (C) Flow cytometric analysis of WT and RelA−/− MSCs with MSC-specific markers, CD73, CD90 and CD105. IgG-FITC, IgG-PE and IgG-APC were used as isotype controls. (D) Immunostaining of WT and RelA−/− VECs with VEC-specific markers, vWF and CD31. DNA was labeled by Hoechst 33342. Scale bar, 30 μm. (E) Immunostaining of WT and RelA−/− VSMCs with VSMC-specific markers, SM22 and Calponin. DNA was labeled by Hoechst 33342. Scale bar, 30 μm. (F) Western blot analysis of RelA protein in WT and RelA−/− VECs, VSMCs and MSCs, respectively. β-Actin was used as a loading control. (G) Immunostaining of RelA in WT and RelA−/− VECs, VSMCs and MSCs under basal condition. DNA was labeled by Hoechst 33342. Scale bar, 10 μm
Figure 3
Figure 3
RelA deficiency affected vascular cell homeostasis. (A) Immunostaining and flow cytometry analysis of the Dil-Ac-LDL uptake capacity in WT and RelA−/− VECs. DNA was labeled by Hoechst 33342. Scale bar, 30 μm. (B) Representative micrographs of matrigel tubes formed by WT and RelA−/− VECs in vitro (n = 3). Scale bar, 3 mm. (C) Oil red O staining of WT and RelA−/− adipocytes derived from MSCs, respectively. The quantification of adipocytes was measured by absorbance at 510 nm (n = 4). *** P < 0.001. Scale bar, 3 mm. (D) Transcriptional expression of adipocyte-specific genes in WT and RelA−/− adipocytes via RT-qPCR detection (n = 4). WT MSCs were used as a negative control. 18S was used as a loading control. * P < 0.05. ** P < 0.01. *** P < 0.001. (E) Representative micrographs of WT and RelA−/− osteoblasts by Von Kossa staining. Scale bar, 3 mm. (F) Transcriptional levels of osteoblast-specific gene expression in WT and RelA−/− osteoblasts via RT-qPCR detection (n = 4). 18S was used as a loading control. (G) Representative toluidine blue staining images of WT and RelA−/− chondrocytes. Scale bar, 3 mm
Figure 4
Figure 4
Inflammatory response defect in RelA−/− vascular cells. (A) Transcriptional expression of NF-κB target genes in WT and RelA−/− VECs, VSMCs, and MSCs under basal condition via RT-qPCR detection (n = 4). (B) Immunostaining of RelA in WT and RelA−/− VECs, VSMCs and MSCs upon 10 ng/mL TNFα treatment. Scale bar, 10 μm. (C) Monocyte adhesion on WT and RelA−/− endothelium under basal and 10 ng/mL TNFα-induced inflammatory conditions (n = 3). Black arrows indicate monocytes. Random fields were selected and the numbers of monocytes were counted by ImageJ software. ns, not significant; * P < 0.05; *** P < 0.001. (D) Transcriptional expression of adhesion molecules in WT and RelA−/− VECs under basal and 10 ng/mL TNFα-induced inflammatory conditions via RT-qPCR detection (n = 4). ns, not significant. *** P < 0.001. (E) Flow cytometric analysis of ICAM1 in WT and RelA−/− VECs, VSMCs and MSCs under basal and 10 ng/mL TNFα-induced inflammatory conditions. The black dotted line represents the mean ICAM1 protein level upon TNFα treatment. IgG-PE was used as an isotype control
Figure 5
Figure 5
RelA deficiency resulted in distinct proliferative activity in various vascular cells. (A) Colony formation of WT and RelA−/− VECs (n = 3). ** P < 0.01. (B) Ki67 immunostaining of WT and RelA−/− VECs (n = 3). DNA was labeled by Hoechst 33342. * P < 0.05. Scale bar, 30 μm. (C) Colony formation of WT and RelA−/− VSMCs (n = 3). ns, not significant. (D) Ki67 immunostaining of WT and RelA−/− VSMCs (n = 3). DNA was labeled by Hoechst 33342. ns, not significant. Scale bar, 30 μm. (E) Colony formation of WT and RelA−/− MSCs at passage 3 (early passage, EP) (n = 3). * P < 0.05. (F) Ki67 immunostaining of WT and RelA−/− MSCs at passage 3 (early passage, EP) (n = 3). DNA was labeled by Hoechst 33342. ns, not significant. Scale bar, 30 μm. (G) Colony formation of WT and RelA−/− MSCs at passage 7 (late passage, LP) (n = 3). *** P < 0.001. (H) Ki67 immunostaining of WT and RelA−/− MSCs at passage 7 (late passage, LP) (n = 3). DNA was labeled by Hoechst 33342. * P < 0.05. Scale bar, 30 μm
Figure 6
Figure 6
RelA deficiency promoted TNFα-induced apoptosis. (A) Flow cytometric analysis of apoptotic vascular cells under basal and 10 ng/mL TNFα-induced conditions. (B) Statistical analysis of apoptotic cells in WT and RelA−/− VECs, VSMCs, and MSCs upon 10 ng/mL TNFα treatment (n = 3). ns, not significant; * P < 0.05; *** P < 0.001
Figure 7
Figure 7
MSCs exhibited similar transcriptional landscapes upon TNFα or IL1β stimulation. (A) Transcriptional expression of ICAM1 and VCAM1 treated with TNFα at indicated concentrations for 1 h or indicated duration at 10 ng/mL via RT-qPCR detection (n = 4). (B) Transcriptional expression of ICAM1 and VCAM1 treated with IL1β at indicated concentrations for 1 h or indicated duration at 10 ng/mL via RT-qPCR detection (n = 4). (C) Scatter plot showing the correlation between RNA-seq replicates of WT and RelA−/− MSCs under basal, TNFα (10 ng/mL)- or IL1β (5 ng/mL)-treated conditions. Pearson correlation coefficient (R) is presented. (D) Heatmap showing the Z-score normalized expression levels (FPKM) of coordinately upregulated genes in WT but not in RelA−/− MSCs upon TNFα or IL1β treatment. (E) Venn diagrams showing the overlap of upregulated genes in WT and RelA−/− MSCs upon TNFα (left) or IL1β (right) treatment. (F) Venn diagram showing the overlap of upregulated genes in WT but not in RelA−/− MSCs upon TNFα or IL1β treatment. (G) Gene ontology (GO) enrichment analysis of upregulated genes presented in biological processes affected by the upregulated genes only in IL1β-treated MSCs (green bars), only in TNFα-treated MSCs (red bars), and in both IL1β- and TNFα-treated MSCs (blue bars)
Figure 8
Figure 8
Transcriptomic analysis revealed RelA deficiency-induced vascular cell dysfunction under basal condition. (A) Transcriptional signal of RelA in WT and RelA−/− VECs, VSMCs, and MSCs. Data were normalized by RPKM (reads per kilo bases per million mapped reads) at bin size of 10 bp. (B) Principle component analysis (PCA) of various vascular cells showing a cell type-specific transcriptional pattern. (C) Heatmap showing the number of differential expressed genes between WT and RelA−/− VECs, VSMCs and MSCs under basal condition. Green color represents downregulated genes; red color represents upregulated genes. (D) Venn diagrams showing the overlap of upregulated (left) and downregulated (right) genes in RelA−/− VECs, VSMCs and MSCs compared to WT. (E) Heatmap showing the transcriptional levels of upregulated genes (RelA-/- vs. WT > 1.5, P adj < 0.05) and downregulated genes (RelA-/- vs. WT < 0.67, P adj < 0.05) in RelA−/− VECs, VSMCs and MSCs compared to WT. All FPKMs of the genes were normalized to WT groups and the relative gene expression levels are presented via Log1.5(RelA-/- / WT) in RelA-/- groups. (F) Transcriptional expression of CLEC11A in WT and RelA−/− VECs, VSMCs, and MSCs via RT-qPCR detection (n = 4). 18S was used as a loading control. *** P < 0.001. (G) Transcriptional expression of CLEC11A in WT MSCs infected with shCLEC11A lentiviruses via RT-qPCR detection (n = 4). shGL2 lentiviruses were used as a negative control; 18S was used as a loading control. ** P < 0.01. (H) Colony formation of WT MSCs infected with shCLEC11A (n = 3). *** P < 0.001. (I) GO enrichment analysis of differentially expressed genes in RelA−/− VECs compared to WT under basal condition. Enriched top GO biological process terms are presented with bars. Green bars represent downregulated genes. (J) GO enrichment analysis of differentially expressed genes in RelA−/− VSMCs compared to WT under basal condition. Red bars represent upregulated genes; green bars represent downregulated genes. (K) GO enrichment analysis of differentially expressed genes in RelA−/− MSCs compared to WT under basal condition. Red bars represent upregulated genes
Figure 9
Figure 9
Transcriptomic analysis revealed RelA deficiency-induced vascular cell dysfunction upon TNFα treatment. (A) Volcano plots showing the differentially expressed genes between basal and TNFα-treated conditions in WT and RelA−/− VECs, VSMCs and MSCs. Green color indicates downregulated genes; red color indicates upregulated genes. The number listed in red or green indicates the number of differentially expressed genes. (B) Venn diagrams showing the overlap of upregulated genes in WT and RelA−/− VECs, VSMCs and MSCs upon TNFα induction. (C) Venn diagram showing the overlap of upregulated genes in WT but not in RelA−/− VECs, VSMCs, and MSCs upon TNFα induction. (D) Network diagram showing enriched GO biological process terms of upregulated genes in WT but not in RelA−/− VECs, VSMCs and MSCs upon TNFα treatment. The size of octagons represents the number of upregulated genes enriched in each term of biological processes. (E) Principal component analysis (PCA) showing a transcriptional pattern shift upon TNFα induction in WT and RelA−/− VECs, VSMCs and MSCs
Figure 10
Figure 10
Transcriptomic analysis revealed the effect of IκBα deficiency on RelA signaling. (A) Schemic diagram of IκBα knockout strategy via CRISPR/Cas9 in human ESCs. A neomycin-resistant cassette (Neo) was included for positive selection. (B) Genomic PCR verification of the deletion of IκBα exon 1 in IκBα−/− ESCs. Water was used as a negative control (NC). (C) Western blot analysis showing IκBα protein levels in WT and IκBα−/− ESCs. β-Actin was used as a loading control. (D) Transcriptional signal of IκBα in WT and IκBα−/− in VECs, VSMCs and MSCs. Transcriptional signals were normalized by RPKM at bin size 10 bp. (E) Venn diagrams showing the overlap between upregulated genes in IκBα−/− vascular cells and downregulated genes in RelA−/− vascular cells compared to WT vascular cells under basal condition. (F) Heatmaps revealing the transcriptional patterns of genes upregulated only in IκBα−/− vascular cells (pink), downregulated only in RelA−/− vascular cells (green), and genes overlapped (blue) under basal condition. (G) Venn diagrams showing the overalp between upregulated genes in IκBα−/− vascular cells and downregulated genes in RelA−/− vascular cells compared to WT vascular cells upon TNFα treatment. (H) Heatmaps revealing the transcriptional patterns of genes upregulated only in IκBα−/− vascular cells (pink), downregulated only in RelA−/− vascular cells (green) and genes overlapped (blue) upon TNFα treatment. (I) Immunostaining of RelA in WT and IκBα−/− MSCs under basal and TNFα-treated conditions. DNA was labeled by Hoechst 33342. Scale bar, 10 μm
Figure 11
Figure 11
A proposed model showing a guardian role of RelA in maintaining human vascular cell homeostasis. (A) Under basal condition, NF-κB/RelA inhibits the proliferation of vascular endothelial cells (VECs) and promotes the self-renewal of mesenchymal stem cells (MSCs) that are the crucial cell type of the adventitia layer. NF-κB/RelA also maintains the multi-differentiation potentials of MSCs. Upon TNFα treatment, RelA mediates vascular inflammation and protects vascular cells from apoptosis. This model suggests a guardian role of RelA in maintaining human blood vessel homeostasis. Notably, IκBα appears to modulate vascular gene expression predominantly in a RelA-independent manner under basal and inflammatory conditions

Similar articles

Cited by

References

    1. Anders S, Pyl PT, Huber W. HTSeq–a Python framework to work with high-throughput sequencing data. Bioinformatics. 2015;31:166–169. doi: 10.1093/bioinformatics/btu638. - DOI - PMC - PubMed
    1. Baker RG, Hayden MS, Ghosh S. NF-kappaB, inflammation, and metabolic disease. Cell Metab. 2011;13:11–22. doi: 10.1016/j.cmet.2010.12.008. - DOI - PMC - PubMed
    1. Barnes PJ, Karin M. Nuclear factor-kappaB: a pivotal transcription factor in chronic inflammatory diseases. N Engl J Med. 1997;336:1066–1071. doi: 10.1056/NEJM199704103361506. - DOI - PubMed
    1. Brand K, Page S, Rogler G, Bartsch A, Brandl R, Knuechel R, Page M, Kaltschmidt C, Baeuerle PA, Neumeier D. Activated transcription factor nuclear factor-kappa B is present in the atherosclerotic lesion. J Clin Invest. 1996;97:1715–1722. doi: 10.1172/JCI118598. - DOI - PMC - PubMed
    1. Breitbach M, Kimura K, Luis TC, Fuegemann CJ, Woll PS, Hesse M, Facchini R, Rieck S, Jobin K, Reinhardt J, et al. In Vivo Labeling by CD73 Marks Multipotent Stromal Cells and Highlights Endothelial Heterogeneity in the Bone Marrow Niche. Cell Stem Cell. 2018;22(262–276):e267. - PubMed

Publication types