. 2018 Jul 3;9(1):2574.
doi: 10.1038/s41467-018-04999-8.

Monoacylglycerol lipase regulates cannabinoid receptor 2-dependent macrophage activation and cancer progression

Affiliations

Monoacylglycerol lipase regulates cannabinoid receptor 2-dependent macrophage activation and cancer progression

Wei Xiang et al. Nat Commun. .

Abstract

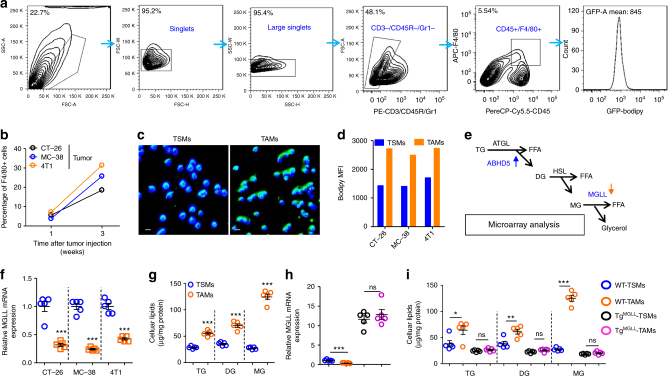
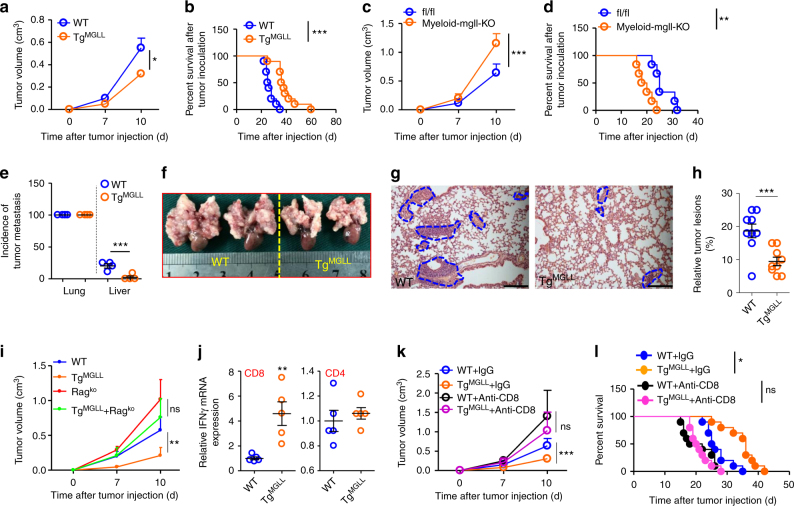
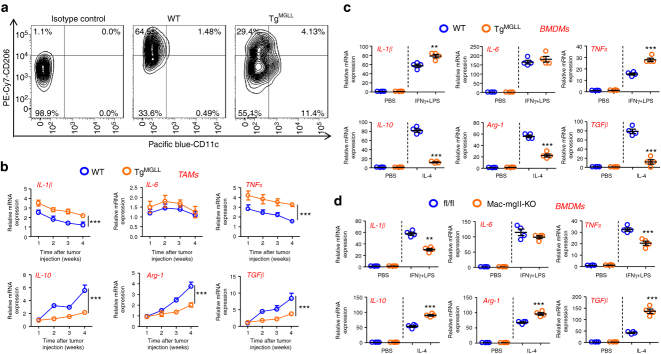
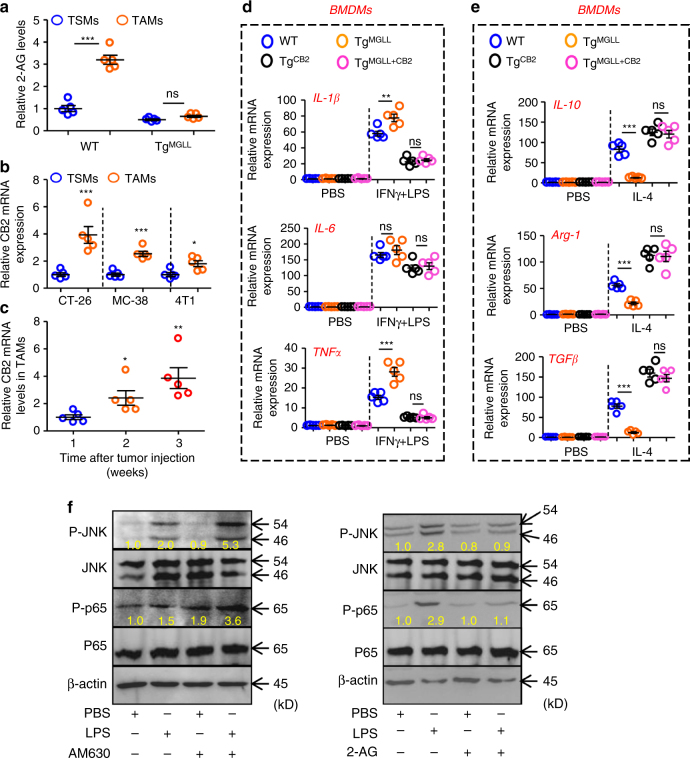
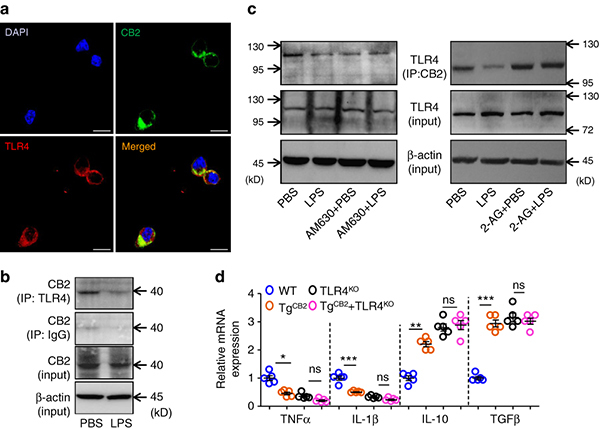
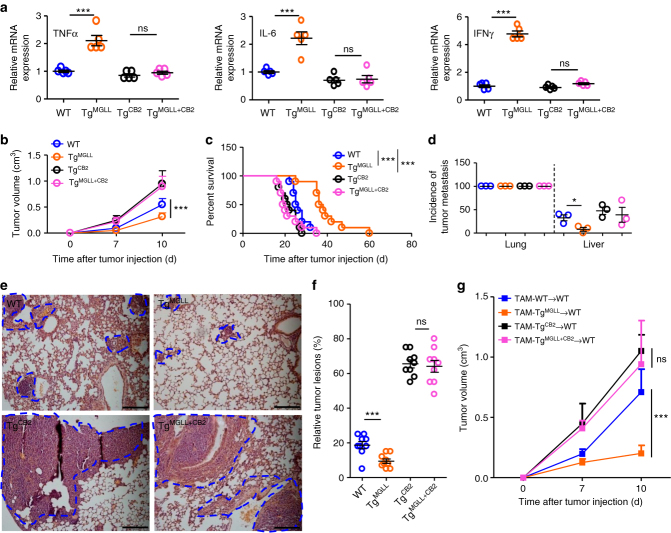
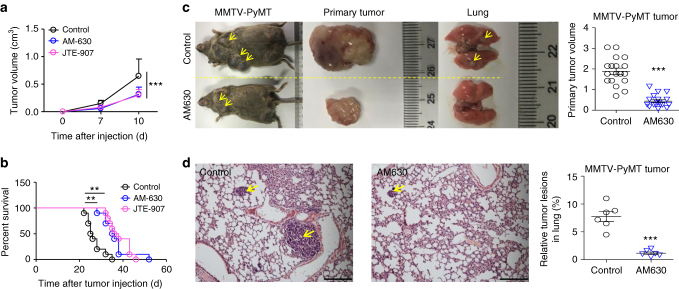
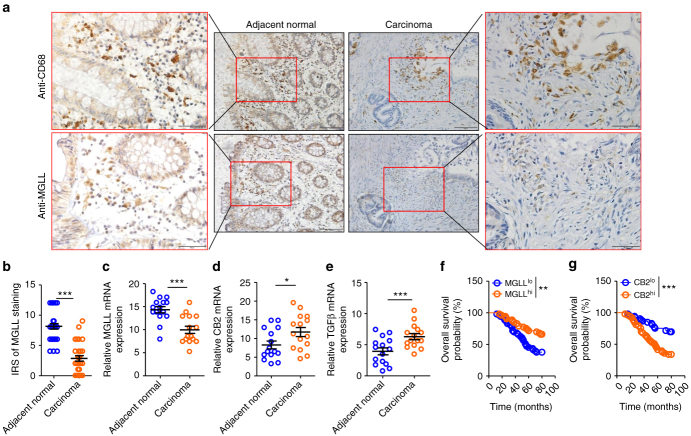
Metabolic reprogramming greatly contributes to the regulation of macrophage activation. However, the mechanism of lipid accumulation and the corresponding function in tumor-associated macrophages (TAMs) remain unclear. With primary investigation in colon cancer and confirmation in other cancer models, here we determine that deficiency of monoacylglycerol lipase (MGLL) results in lipid overload in TAMs. Functionally, macrophage MGLL inhibits CB2 cannabinoid receptor-dependent tumor progression in inoculated and genetic cancer models. Mechanistically, MGLL deficiency promotes CB2/TLR4-dependent macrophage activation, which further suppresses the function of tumor-associated CD8+ T cells. Treatment with CB2 antagonists delays tumor progression in inoculated and genetic cancer models. Finally, we verify that expression of macrophage MGLL is decreased in cancer tissues and positively correlated with the survival of cancer patients. Taken together, our findings identify MGLL as a switch for CB2/TLR4-dependent macrophage activation and provide potential targets for cancer therapy.


Conflict of interest statement

The authors declare no competing interests.

Figures

Fig. 1
Fig. 1
MGLL deficiency in tumor-associated macrophages results in lipid accumulation. a FACS gating strategy for tissue macrophages and lipid measurement. Debris and doublets were removed, and tissue macrophages were then assessed as CD3-CD45R-Gr1-CD45+F4/80+. The average fluorescence degree of macrophages stained by Bodipy (GFP) was measured. b The percentage of TAMs in inoculated tumors. Six-week-old WT mice were subcutaneously inoculated with CT-26, MC-38 or 4T1 cells and the TAMs were quantified at 1st and 3rd week. Each tested sample was pooled from five individual ones. c Lipid staining of macrophages from spleens (TSMs) or tumors (TAMs). Six-week-old mice were subcutaneously inoculated with MC-38 tumors and sacrificed two weeks later. Tissue macrophages were isolated and stained with Bodipy (Green). The nucleus was visualized by DAPI staining (Blue). This experiment was repeated four times. Representative images are displayed. Scale bars, 10 μm. d The lipid levels in TSMs and TAMs. Six-week-old mice were subcutaneously injected with indicated cells. Two weeks later, TSMs and TAMs were isolated for lipid staining with bodipy. The Geometric mean fluorescence intensity (MFI) of Bodipy in each group was measured. Each tested sample was pooled from five individual ones. e A diagram of glycerolipid metabolism. The blue arrow indicates up-regulation, and the orange arrow indicates down-regulation. A gene-microarray analysis was performed on the peritoneal macrophages, which were treated with regular or conditioned medium from CT-26 cells for 24 h. TG triglyceride, DG diglyceride, MG monoglyceride. f Relative mRNA expression of MGLL in TSMs and TAMs. Six-week-old mice were subcutaneously inoculated with indicated tumors and sacrificed two weeks later. TSMs and TAMs were isolated for real-time PCR assays. g Cellular lipid levels were measured in TSMs and TAMs from the MC-38 tumor-bearing mice as described in c. h Relative mRNA expression of MGLL in TSMs and TAMs. Six-week-old WT or myeloid MGLL transgenic (TgMGLL) mice were subcutaneously inoculated with MC-38 tumors for 2 weeks. TSMs and TAMs were then isolated for mRNA assays of MGLL. i Cellular lipid levels in TSMs and TAMs from the MC-38 tumor-bearing mice as described in h. Data in fi represent the means ± s.e.ms (n = 5, *P < 0.05, **P < 0.01, ***P < 0.005; student’s t-test; ns not significant)
Fig. 2
Fig. 2
Macrophage MGLL inhibits tumor progression via CD8+T cells. a Six-week-old WT and TgMGLL mice were subcutaneously inoculated with MC-38 cells, and tumor volumes were measured dynamically. This test was performed four times. (n = 10) b The survival time of the MC-38 tumor-bearing mice described in a. The data represent the means ± s.e.ms. (n = 10, ***P < 0.005, Gehan-Breslow-Wilcoxon test). c The growth curves of the subcutaneous MC-38 tumors in Myeloid-mgll-KO mice and the control littermates (fl/fl). (n = 6). d The survival time of the MC-38 tumor-bearing mice described in c. The data represent the means ± s.e.ms. (n = 6, **P < 0.01, Gehan-Breslow-Wilcoxon test). e Incidence of metastasis in lungs and livers of the intravenous tumor model. The 6-week-old C57BL/6 WT or transgenic mice were intravenously injected with MC-38 colorectal cancer cells (5 × 106 cells per mouse) via the tail vein. The mice were sacrificed 2 weeks after tumor inoculation. The lungs and livers were dissected for pathological observation of tumor lesions. Data are means ± s.e.ms. and polled from four individual experiments. Each symbol represents an experimental replicate (n = 8~11). fh The MC-38 tumor lesions in lungs of WT and TgMGLL mice, as described in e. Representative images of gross anatomy (f) and H&E staining (g) are displayed. The blue dotted lines indicate the tumor lesions. The relative tumor lesions were calculated (h). Scale bars, 200 μm. (n = 8~9). i Macrophage MGLL inhibited tumor growth in a Rag-1 dependent mannaer. MC-38 tumors were inoculated subcutaneously in WT, TgMGLL, Rag1KO or TgMGLL + Rag1KO mice and the tumor volumes were measured dynamically. (n = 5) j mRNA levels of IFNγ in CD8+ or CD4+ T cells that were isolated from the MC-38 tumors inoculated subcutaneously in WT or TgMGLL mice for 3 weeks. (n = 5). k Six-week-old WT or TgMGLL mice were subcutaneously inoculated with MC-38 cells and treated with anti-CD8 antibody or IgG as a control. The tumor volume was measured dynamically. (n = 10). l The survival time of the MC-38 tumor-bearing mice treated as described in k. The data represent the means ± s.e.ms. (n = 10, *P < 0.05, Gehan-Breslow-Wilcoxon test; ns, not significant). Data in a, c and ek represent the means ± s.e.ms. (*P < 0.05, **P < 0.01, ***P < 0.005; student’s t-test; ns not significant)
Fig. 3
Fig. 3
MGLL potentiates proinflammatory cytokine expression in tumor-associated macrophages. a Quantification of M1-like and M2-like TAMs in MC-38 tumors which were subcutaneously inoculated for 3 weeks in WT or TgMGLL mice. Each tested sample was pooled from five individual ones. The M1-like TAMs were assed as CD3-CD45R-Gr1-GFP-CD45+F4/80+CD11c+CD206-; The M2-like TAMs were assed as CD3-CD45R-Gr1-GFP-CD45+F4/80+CD206+CD11c-. The inoculated MC-38 cells were stably marked with GFP. This test was repeated three times. Representative results were displayed. b mRNA expression of cytokines, as indicated, in the TAMs from WT or TgMGLL mice were measured dynamically (n = 5, ***P < 0.005). c MGLL potentiates M1 and blocks M2 activation of macrophages. The BMDMs from WT or TgMGLL mice were treated with IFNγ (10 ng ml−1) + LPS (100 ng ml−1) or IL-4 (10 ng ml−1) for 6 h and then subjected to real-time PCR assays (n = 4, **P < 0.01, ***P < 0.005). d mRNA levels of cytokines in the fl/fl or Mac-mgll-KO mice-derived BMDMs treated with IFNγ (10 ng ml−1) + LPS (100 ng ml−1) or IL-4 (10 ng ml−1) for 6 h (n = 4, **P < 0.01, ***P < 0.005). Data in bd represent the means ± s.e.ms. (Student’s t-test)
Fig. 4
Fig. 4
MGLL regulates macrophage activation via CB2 signal. a Relative 2-AG levels in TSMs and TAMs. Six-week-old mice were subcutaneously inoculated with MC-38 cells for 3 weeks. TSMs and TAMs were isolated for 2-AG assays. (n = 5) b Relative CB2 mRNA levels in TSMs and TAMs from 9-week-old mice inoculated with indicated subcutaneous tumors for 3 weeks. (n = 5) c Relative CB2 mRNA levels in TAMs from MC-38 tumor tissues as indicated time points after tumor injection in WT mice. (n = 5) d Relative mRNA expression of proinflammatory cytokines in the PBS- or IFNγ (10 ng ml−1) + LPS (100 ng ml−1)-treated BMDMs from the WT, TgMGLL, TgCB2 or TgMGLL+CB2 mice. (n = 5) e Relative mRNA levels of ant-inflammatory cytokines in the PBS- or IL-4 (10 ng ml−1)-treated BMDMs from the mice described in d. (n = 5) f CB2 antagonizes TLR-4 signaling. Mouse peritoneal macrophages (PMs) were primed with PBS, a CB2 inhibitor AM630 (200 nM) or a CB2 activator 2-AG (10 μM) for 2 h, and then additionally treated with PBS or LPS (500 ng ml−1) for 30 min before harvested for immunoblotting assays. The yellow values indicated the relative expression (P-JNK/JNK or P-p65/p65) according to the density. The expression value in control group for each interested protein was set as 1. Data in ae are means ± s.e.ms. (*P < 0.05, **P < 0.01, ***P < 0.005; student’s t-test; ns not significant)
Fig. 5
Fig. 5
CB2 antagonizes TLR-4 signaling in macrophages. a The PMs were double-stained with TLR4 (Red) and CB2 (Green) antibodies by immunofluorescence. The nucleus was visualized by DAPI staining (Blue). This test was repeated three times. Representative images were shown. Scale bars, 40 μm. b Protein–protein Interaction between CB2 and TLR4 in the mouse peritoneal macrophages treated with PBS or LPS (500 ng ml−1) for 30 min. The proteins were immunoprecipitated with TLR4 antibody or IgG as control. This test was repeated three times. Representative results were displayed. c LPS or AM630 inhibits, while 2-AG induces the Interaction between CB2 and TLR4 in macrophages. The mouse PMs described in f were harvested and the proteins were immunoprecipitated with CB2 antibody. d Relative mRNA levels of inflammatory cytokines in the TAMs from the WT, TgCB2, TLR4KO or TgCB2 + TLR4KO mice bearing MC-38 tumors for 3 weeks. (n = 5) Data in j are means ± s.e.ms. (*P < 0.05, **P < 0.01, ***P < 0.005; student’s t-test; ns not significant)
Fig. 6
Fig. 6
MGLL-CB2 axis regulates tumor progression in mice. a Relative mRNA levels of TNFα, IL-6 and IFNγ in the CD8+ T cells in the MC-38 tumors inoculated subcutaneously in WT, TgMGLL, TgCB2, and TgMGLL+CB2 mice. The data represent the means ± s.e.ms. (n = 5, ***P < 0.005, Student’s t-test; ns not significant). b Six-week-old WT, TgMGLL, TgCB2, and TgMGLL+CB2 mice were subcutaneously inoculated with MC-38 cells, and the tumor volume was measured dynamically. This experiment was repeated three times. The data represent the means ± s.e.ms. (n = 10, **P < 0.01, ***P < 0.005, Student’s t-test). c The survival time of the MC-38 tumor-bearing mice. The mice were described in b. The data represent the means ± s.e.ms. (n = 10, **P < 0.01, ***P < 0.005, Gehan-Breslow-Wilcoxon test). d The incidence of tumor metastasis in MC-38 tumor model. Six-week-old WT, TgMGLL, TgCB2, and TgMGLL+CB2 mice were intravenously injected with MC-38 cells via the tail vein, and the metastases in the lungs and livers were checked 3 weeks later. This experiment was repeated three times. The data represent the means ± s.e.ms. (n = 6~10, *P < 0.05, Student’s t-test). e H&E staining of the lungs from the MC-38 tumor-bearing WT, TgMGLL, TgCB2, and TgMGLL+CB2 mice as described in d.The blue dotted lines indicate the tumor lesions. Scale bars, 200 μm. f Relative tumor lesions were calculated. The data represent the means ± s.e.ms. (n = 9, ***P < 0.005, Student’s t-test). g Volume of tumors from WT mice implanted with MC-38 cells admixed 2:1 with macrophages isolated from corresponding tumors grown in WT, TgMGLL, TgCB2 or TgMGLL+CB2 mice. The data represent the means ± s.e.ms (n = 5, ***P < 0.005, Student’s t-test; ns not significant)
Fig. 7
Fig. 7
Targeting CB2 delays tumor progression. a CB2 antagonists inhibit tumor growth. Six-week-old mice were subcutaneously inoculated with MC-38 tumors and treated with CB2 antagonists, AM-630 (0.3 mg kg−1 d−1, i.p.) or JTE-907 (0.5 mg kg−1 d−1, i.p.). The tumor volume was measured dynamically. The data represent means ± s.e.ms. (n = 10, ***P < 0.005, Student’s t-test). b CB2 antagonists improve the survival of tumor-bearing mice. The MC-38 tumor-bearing mice were described in a. The survival time was recorded. The experiment was repeated twice (n = 10, **P < 0.01, Gehan-Breslow-Wilcoxon test). c The MMTV-PyMT mice were treated with PBS or AM630 (0.3 mg kg−1 d−1, i.p.) starting from 6 weeks old and sacrificed at 14 weeks old. The representative gross morphology of primary mammary tumors and lung metastasis were displayed. The size of the primary mammary tumors were calculated. (n = 6, ***P < 0.005, Student’s t-test). d Tumor lesions in lungs from the mice described in c (n = 6, ***P < 0.005, Student’s t-test). Scale bars, 200 μm
Fig. 8
Fig. 8
Expression of macrophage MGLL is decreased in carcinoma tissues and positively correlated to the survival of patients with CRC. a Representative images from immunohistochemical staining of CD68+ cells (macrophages) in adjacent normal tissue and carcinoma tissue. The corresponding area of infiltrated macrophages was stained with MGLL antibody on the consecutive slides. MGLL expression in macrophages in carcinoma was much lower than that in adjacent normal tissues. The representative areas of macrophages at higher magnification are displayed in the red square areas. The scale bar at higher magnification represents 50 μm and at lower magnification represents 200 μm. b The statistical data were obtained from immunohistochemical staining analysis of 30 samples from 30 patients. The data represent the means ± s.e.ms. (n = 30, ***P < 0.005, Student’s t-test). ce The relative mRNA expression of MGLL (c), CB2 (d), and TGFβ (e) in macrophages from the carcinoma tissues or adjacent normal tissues. The macrophages were isolated from fresh carcinoma tissues or adjacent normal tissues from CRC patients who underwent surgery, and the macrophages were subjected to real-time PCR assays. The data represent the means ± s.e.ms. (n = 15, *P < 0.05, ***P < 0.005, Student’s t-test). fg Overall survival of patients with CRC with differential expression of MGLL (f) or CB2 (g) in TAMs. The investigated patients were classified into two groups according to the mRNA expression of MGLL or CB2 in TAMs. The 50% of patients with high TAM MGLL or CB2 expression were assigned to group MGLLhi or CB2hi, respectively. The remaining patients with low TAM MGLL or CB2 expression were assigned to group MGLLlo or CB2lo, respectively. The overall survival time of the patients were obtained via follow-up visit (n = 53, **P < 0.01, ***P < 0.005, Gehan-Breslow-Wilcoxon test)

Similar articles

Cited by

References

    1. Yang W, et al. Potentiating the antitumour response of CD8(+) T cells by modulating cholesterol metabolism. Nature. 2016;531:651–655. doi: 10.1038/nature17412. - DOI - PMC - PubMed
    1. Miao H, et al. Macrophage ABHD5 promotes colorectal cancer growth by suppressing spermidine production by SRM. Nat. Commun. 2016;7:11716. doi: 10.1038/ncomms11716. - DOI - PMC - PubMed
    1. Sharma P, Allison JP. The future of immune checkpoint therapy. Science. 2015;348:56–61. doi: 10.1126/science.aaa8172. - DOI - PubMed
    1. Strachan DC, et al. CSF1R inhibition delays cervical and mammary tumor growth in murine models by attenuating the turnover of tumor-associated macrophages and enhancing infiltration by CD8+ T cells. Oncoimmunology. 2013;2:e26968. doi: 10.4161/onci.26968. - DOI - PMC - PubMed
    1. Xue J, et al. Transcriptome-based network analysis reveals a spectrum model of human macrophage activation. Immunity. 2014;40:274–288. doi: 10.1016/j.immuni.2014.01.006. - DOI - PMC - PubMed

Publication types

MeSH terms