. 2018 Jul 3;9(1):2592.
doi: 10.1038/s41467-018-05008-8.

A senataxin-associated exonuclease SAN1 is required for resistance to DNA interstrand cross-links

Affiliations

A senataxin-associated exonuclease SAN1 is required for resistance to DNA interstrand cross-links

Alex M Andrews et al. Nat Commun. .

Abstract

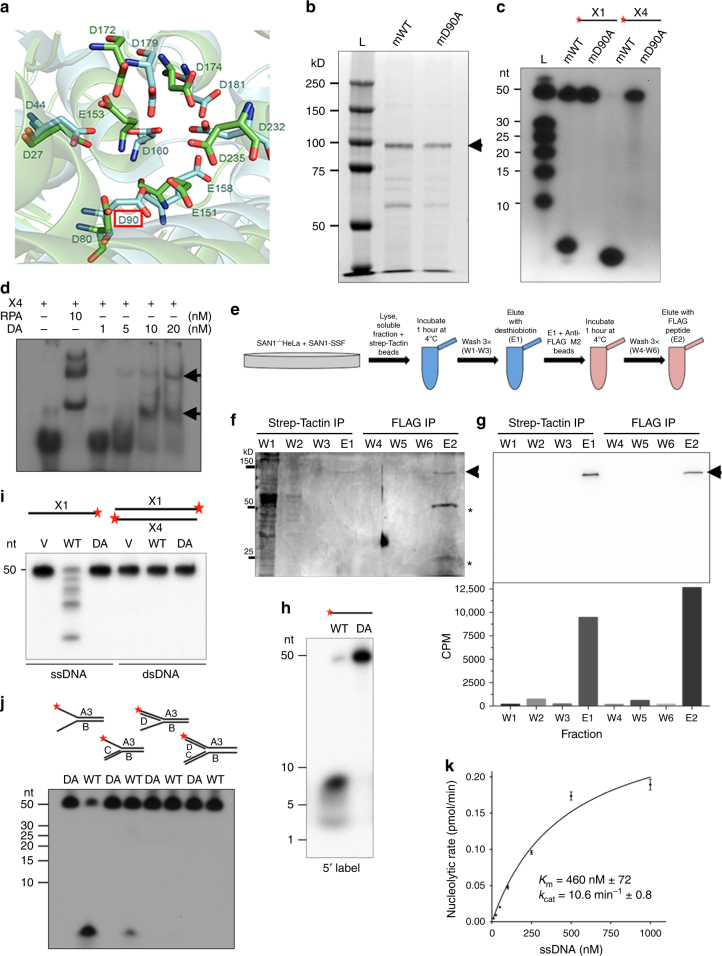
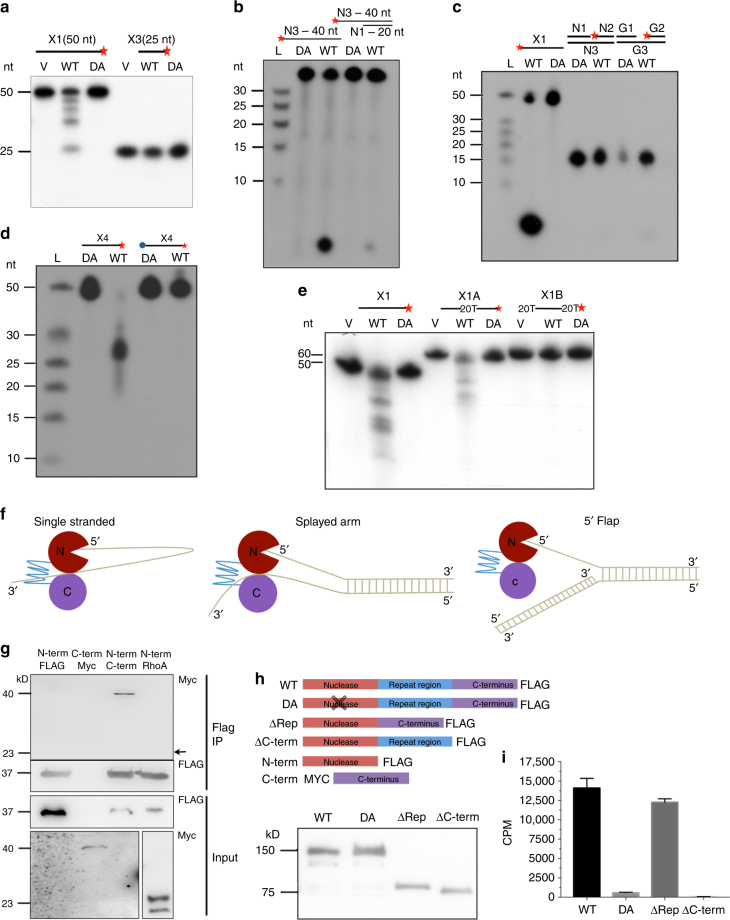
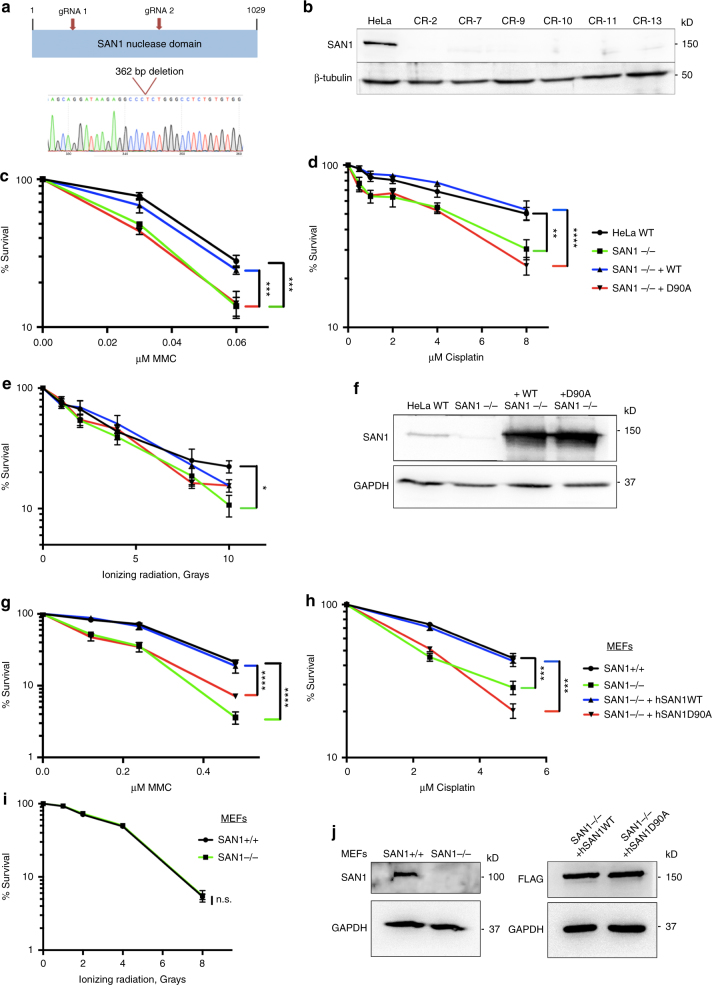
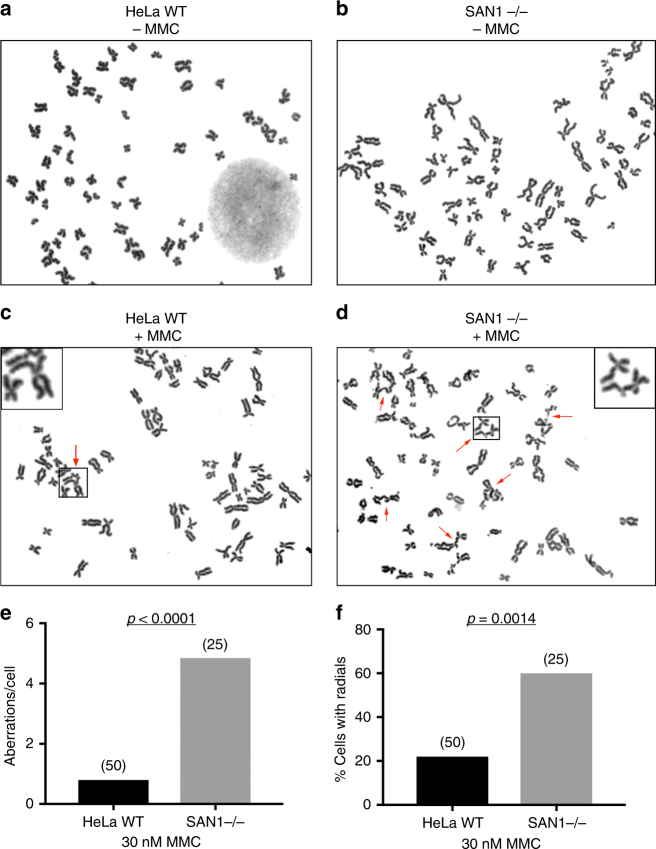
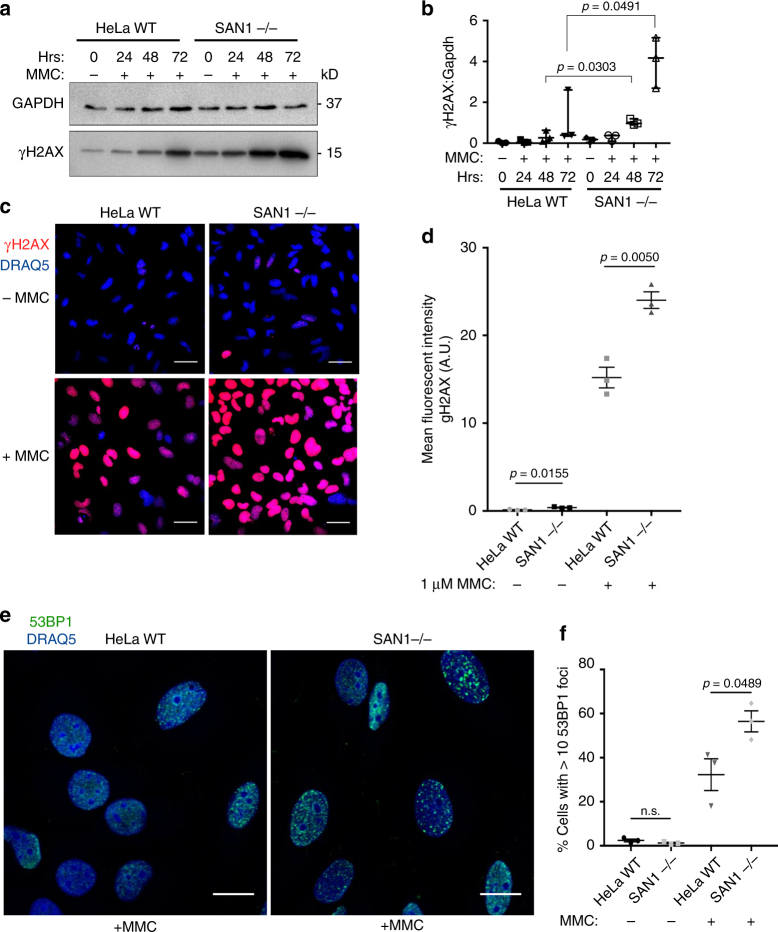
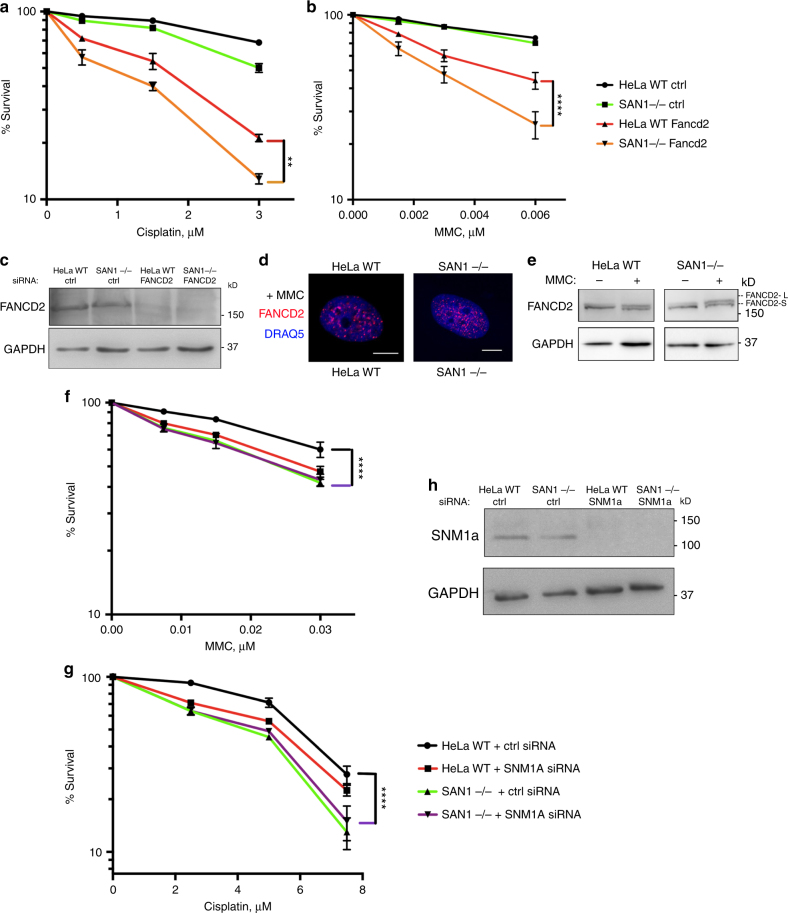
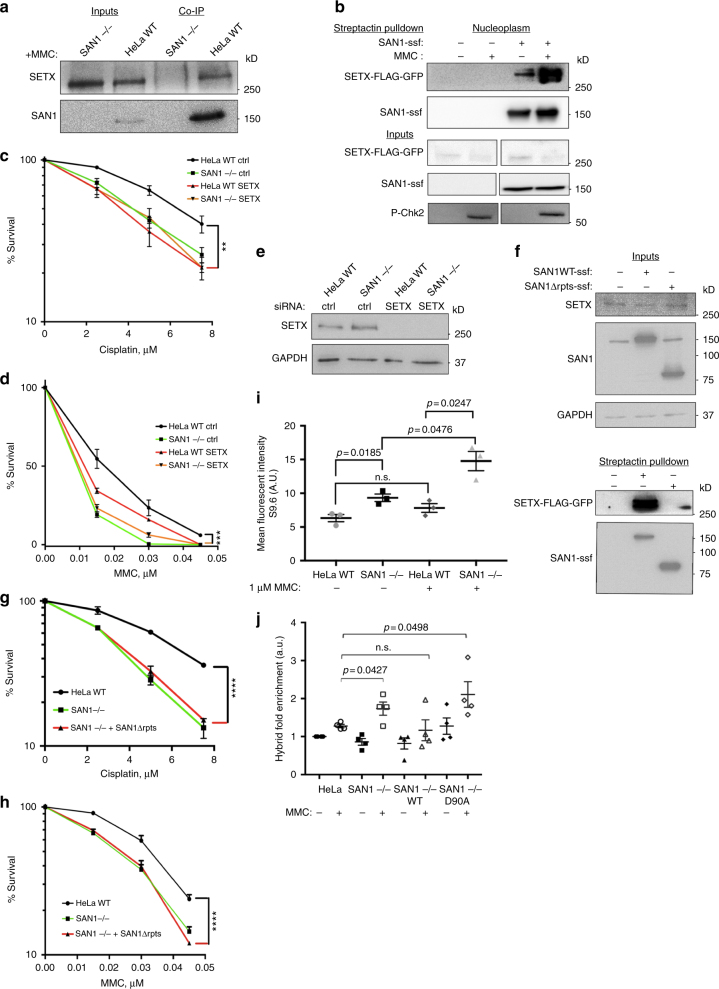
Interstrand DNA cross-links (ICLs) block both replication and transcription, and are commonly repaired by the Fanconi anemia (FA) pathway. However, FA-independent repair mechanisms of ICLs remain poorly understood. Here we report a previously uncharacterized protein, SAN1, as a 5' exonuclease that acts independently of the FA pathway in response to ICLs. Deletion of SAN1 in HeLa cells and mouse embryonic fibroblasts causes sensitivity to ICLs, which is prevented by re-expression of wild type but not nuclease-dead SAN1. SAN1 deletion causes DNA damage and radial chromosome formation following treatment with Mitomycin C, phenocopying defects in the FA pathway. However, SAN1 deletion is not epistatic with FANCD2, a core FA pathway component. Unexpectedly, SAN1 binds to Senataxin (SETX), an RNA/DNA helicase that resolves R-loops. SAN1-SETX binding is increased by ICLs, and is required to prevent cross-link sensitivity. We propose that SAN1 functions with SETX in a pathway necessary for resistance to ICLs.


Conflict of interest statement

The authors declare no competing interests.

Figures

Fig. 1
Fig. 1
Identification and characterization of the SAN1 nuclease. a Modeling of conserved carboxylates in active site of SAN1 (light blue), using the Robetta server (http://robetta.bakerlab.org) and the A. fulgidus FEN1 structure (PDB 1RXW) (green) as template. Residue highlighted by red box is the aspartate mutated to make D90A. b Murine SAN1 was expressed with a C-terminal Strep tag in E. coli and purified over Strep-Tactin beads. Purified protein (0.2 µg) was analyzed by PAGE and stained with Coomassie. Arrow shows mSAN1 expected size of 100 kD. c Synthetic 50-mer oligos were 5′ labeled with 32P and incubated with mSAN1 for 120 min. Products were separated by PAGE and 32P-fragments were detected by autoradiography (see Table 1 for sequences). d 50 nt X4 was 5′ 32P labeled and incubated with RPA as a positive control or increasing concentrations of SAN1 D90A (catalytically inactive). Samples were analyzed on a native gel and exposed to X-ray film. e Schematic of double-affinity Strep-FLAG tag purification for human SAN1 WT and SAN1 DA. f Silver stained fractions from the purification where “W” denotes Wash steps and “E” denotes Elution steps for the Strep and FLAG IPs. Arrow shows human SAN1 WT (expected size 150 kD) and asterisks show FLAG antibody heavy and light chains. g Top panel shows immunoblot of fractions from two-step purification of SAN1 where arrow shows SAN1 (expected size 150 kD), detected using mouse M2 anti-FLAG-antibody. Bottom panel shows corresponding filter spin nuclease assay. h X1 (50-mer ssDNA) was 5′ labeled with 32P and incubated with SAN1 WT or the D90A mutant. Products were analyzed as in c. i X4 ssDNA or dsDNA X1 + X4 were 3′ 32P labeled and incubated with WT or D90A SAN1. Products were analyzed as in h. j FLAG-tagged SAN1 WT or D90A was incubated with 5′ 32P labeled splayed duplex, 3′ flap, or 5′ flap structures for 2 h at 37 °C. Products were processed as in c. k Using the filter spin assay, initial rates of 5′ 32P-labeled X4 hydrolysis were measured at different substrate concentrations. Line was fitted using Prism software, assuming Michaelis-Menten kinetics
Fig. 2
Fig. 2
SAN1 acts as a 5′ exonuclease on single-stranded DNA substrates. Affinity-purified FLAG-SAN1 WT or -D90A from 293T cells incubated with a 50 nt ssDNA versus 25 nt ssDNA; b 40 nt ssDNA versus a 20 nt ssDNA 5′ overhang followed by 20 bp of dsDNA; c dsDNA oligos with an internal nick or gap; d 5′ biotinylated X4 and unbiotinylated X4; e variants of ssDNA oligo X1 with 20 Ts 5′ and 3′ to 20 nts of X1, or a tract of 20 Ts bounded by two 20 nt sections of the X1 sequence all for 2 h at 37 °C. DNA structures assayed in b, c were 5’ 32P labeled and structures in a, d, e were 3′ 32P labeled. Products were separated by PAGE and 32P fragments were detected by autoradiography. f Schematic of a model for SAN1 nuclease activity. SAN1 acts on ssDNA substrates by recognizing the free 5′ end of DNA and cleaving ~3 or ~7 nts from the 5′ end, in a non-processive manner. g The N-terminal FLAG-tagged nuclease domain was co-expressed in 293T cells with C-terminal Myc-tagged SAN1 C-terminus, or Myc-RhoA as a negative control. Lysates were precipitated with anti-FLAG M2 beads and analyzed by immunoblot. The Myc Input membrane was re-exposed for a longer time to detect Myc-SAN1 C-terminus. The SAN1 C-terminal domain but not RhoA is co-precipitated with the nuclease domain. h Schematic of SAN1 deletion mutants used in f, g, h followed by immunoblot of WT, DA, ΔRep, and ΔC-term proteins purified from 293T cells; and i tested for nuclease activity against 5′ 32P labeled ssDNA using the filter spin assay (N = 2, error bars show range)
Fig. 3
Fig. 3
Loss of SAN1 leads to sensitization of cells to ICLs. a Schematic showing CRISPR-Cas9 strategy to create SAN1-/- HeLa cell lines. Two guide RNAs were used to delete a 362 bp region of exon 1 in the fam120b gene locus, which contains the conserved FEN1 family nuclease domain. b Immunoblot of HeLa WT parental cell line and CRISPR-Cas9 generated SAN1-/- cell lines showing loss of SAN1 expression (lanes 1–7). β-tubulin was used as a loading control. ce SAN1-/- cells were transduced with lentiviral constructs expressing Strep2-FLAG tagged SAN1 WT or the D90A mutant to create stable rescue cell lines. Colony survival assays (CSAs) were then performed using HeLa WT, SAN1−/−, and WT or D90A rescue lines with MMC, Cisplatin, or ionizing radiation (N > 3). Statistical significance determined by two-way ANOVA comparing HeLa WT and SAN1−/− or SAN1−/− +WT and SAN1-/- +D90A. Error bars denote s.e.m. *p < 0.05, **p < 0.01, ***p < 0.001, ****p < 0.0001. f Immunoblot showing SAN1 expression in HeLa WT, SAN1−/−, and SAN1 WT and D90A rescue lines. GAPDH was a loading control. gi SAN1+/− mice were crossed to generate SAN1+/+ and −/− mouse embryonic fibroblasts (MEFs). The MEFs were immortalized using SV40 large T antigen, and the SAN1−/− MEFs were transduced with lentiviral constructs containing Strep2-FLAG-tagged human SAN1 WT or SAN1 D90A. These cell lines were then used for CSAs with MMC, Cisplatin, or ionizing radiation (N = 3). j Immunoblot showing mouse SAN1 expression in SAN1+/+ and −/− MEFs (left panel) and hSAN1WT and hSAN1D90A expression in SAN1−/− cells (right panel). GAPDH was used as a loading control. Statistical significance for CSAs was determined by two-way ANOVA test comparing SAN1+/+ and SAN1−/− or SAN1−/− +hSAN1WT and SAN1−/− +hSAN1D90A
Fig. 4
Fig. 4
SAN−/− cells display increased levels of radial chromosomes in response to MMC. a, b Micrographs of metaphase spreads from untreated HeLa WT and SAN1−/− cells. c, d Micrographs of metaphase spreads of HeLa WT and SAN1−/− cells following treatment with 30 nM MMC, showing large increase in radials or other chromosomal aberrations in SAN1−/− cells. Red arrows indicate radial chromosomes or aberrations. e, f Quantification of aberrations/cell and percentage of radials/cell for HeLa WT and SAN1−/− cells treated with MMC. Metaphase spreads from 50 HeLa WT cells were analyzed (11 radial forms, 11 cells with radials, 40 aberrations). Metaphase spreads from 25 SAN1−/− cells were analyzed (42 radial forms, 15 cells with radials, 121 aberrations). Data were analyzed in Prism GraphPad from contingency tables using Fisher’s exact-test (two-sided p value)
Fig. 5
Fig. 5
Increased levels of DNA damage in SAN1−/− cells exposed to MMC. a Immunoblots of γH2AX from HeLa WT and SAN1−/− cells treated for various times with vehicle or 0.045 μM MMC. GAPDH was a loading control. b Quantification of immunoblot time course (N = 3). Statistical significance determined by t-test with Welch’s correction. c Immunofluorescence (IF) staining of γH2AX and DNA (Draq5) 30 hrs after treatment with vehicle or 1 μM MMC. d Quantification of γH2AX intensity in vehicle and MMC treated HeLa WT and SAN1−/− cells. Statistical significance determined by t-test with Welch’s correction (N = 3 biological replicates, at least 250 cells per sample were analyzed). e IF staining of 53BP1 and DNA (Draq5) 30 h post-treatment with vehicle or 1 μM MMC. f Quantification of percentage of cells with >10 53BP1 foci in HeLa WT and SAN1−/− cells. Statistical significance determined by unpaired t-test (N = 3 biological replicates, at least 200 cells per sample were analyzed)
Fig. 6
Fig. 6
SAN1 functions independently of the FA pathway and does not affect FA pathway activation. a, b CSAs of HeLa WT and SAN1−/− cells treated with scrambled ctrl siRNA or FANCD2 siRNA, in response to Cisplatin and MMC (N = 3). Statistical significance determined by two-way ANOVA. Error bars denote s.e.m. *p < 0.05, **p < 0.01, ***p < 0.001, ****p < 0.0001. c Immunoblot showing siRNA knockdown of FANCD2 in HeLa WT and SAN1−/− cells. d IF staining of FANCD2 foci in HeLa WT cells and SAN1−/− cells treated with 0.045 μM MMC. e Immunoblot of FANCD2 showing mono-ubiquitylation in HeLa WT and SAN1−/− cells treated with vehicle or 0.045 μM MMC. f, g CSAs of HeLa WT and SAN1−/− cells treated with ctrl or SNM1A siRNA and exposed to Cisplatin or MMC. Statistical significance was determined by two-way ANOVA test. h Immunoblot of SNM1A in HeLa WT and SAN1−/− cells treated with ctrl or SNM1A siRNA
Fig. 7
Fig. 7
SAN1 interacts with the RNA/DNA helicase sSenataxin. a Endogenous SAN1 was co-immunoprecipitated from HeLa WT and SAN1−/− after treatment with 1 μM MMC. Top panel: immunoblot (IB) of Senataxin inputs (lanes 1–2) and Co-IP (lanes 3–4), bottom panel: IB of SAN1 inputs (2%) (lanes 1–2), and Co-IP (lanes 3–4). b A stable HeLa cell line expressing near endogenous levels of a Senataxin-FLAG-GFP construct was transduced with a lentiviral construct of SAN1WT-Strep2-FLAG (SAN1ssf). Soluble nuclear fraction was isolated from the cells and SAN1 was captured on Strep-Tactin beads. Top panel: IB for Senataxin and SAN1 of precipitations from HeLa SETX-FLAG-GFP cell line +/- SAN1-ssf and +/- MMC. Bottom panel: Input IB for Senataxin, SAN1 and P-Chk2 from HeLa SETX-FLAG-GFP cell lines +/- SAN1-ssf, and +/- 1μM MMC. c, d CSAs of HeLa WT and SAN1−/− cells, transfected with scrambled ctrl or SETX siRNAs, in response to Cisplatin and MMC. Statistical significance determined by two-way ANOVA. Error bars denote s.e.m. *p < 0.05, **p < 0.01, ***p < 0.001, ****p < 0.0001. MMC CSA is shown in linear scale in d due to zero values at higher MMC concentrations. e IB of SETX siRNA knockdown. f Cells were fractionated to prepare the soluble nuclear fraction as in b and was captured on Strep-Tactin beads. Upper panel: IB of inputs for stable HeLa cell lines expressing near endogenous levels of a Senataxin-FLAG-GFP construct and over-expressing SAN1WT-Strep2-FLAG (SAN1ssf) or SAN1 lacking the central repeats region (SAN1ΔRep-ssf). Lower panel: co-immunoprecipation of SETX-FLAG with SAN1WT-ssf but not SAN1ΔRep-ssf. g, h CSAs for HeLa WT, SAN1−/−, and SAN1−/− +SAN1ΔRep-ssf cells exposed to Cisplatin and MMC. Statistical significance determined by two-way ANOVA. i Quantification of nuclear R-loop intensity (N = 3). HeLa WT and SAN1−/− cells were treated with vehicle or 1 μM MMC and labeled with a monoclonal antibody to detect RNA/DNA hybrids (S9.6), nucleolin, and Draq5. Statistical significance calculated using unpaired t-test (N = 3 biological replicates, at least 60 cells per sample were analyzed). j Dot blot assay for quantification of RNA/DNA hybrids. (N = 4) Statistical significance determined by unpaired t-test comparing each condition to HeLa WT untreated

References

    1. Ceccaldi R, Sarangi P, D’Andrea AD. The Fanconi anaemia pathway: new players and new functions. Nat. Rev. Mol. Cell Biol. 2016;17:337–349. doi: 10.1038/nrm.2016.48. - DOI - PubMed
    1. Wang W. Emergence of a DNA-damage response network consisting of Fanconi anaemia and BRCA proteins. Nat. Rev. Genet. 2007;8:735–748. doi: 10.1038/nrg2159. - DOI - PubMed
    1. Nakanishi K, et al. Homology-directed Fanconi anemia pathway cross-link repair is dependent on DNA replication. Nat. Struct. Mol. Biol. 2011;18:500–503. doi: 10.1038/nsmb.2029. - DOI - PMC - PubMed
    1. Deans AJ, West SC. FANCM connects the genome instability disorders Bloom’s Syndrome and Fanconi Anemia. Mol. Cell. 2009;36:943–953. doi: 10.1016/j.molcel.2009.12.006. - DOI - PubMed
    1. Enoiu M, Jiricny J, Scharer OD. Repair of cisplatin-induced DNA interstrand crosslinks by a replication-independent pathway involving transcription-coupled repair and translesion synthesis. Nucleic Acids Res. 2012;40:8953–8964. doi: 10.1093/nar/gks670. - DOI - PMC - PubMed

Publication types

MeSH terms