. 2018 Jul 3;8(1):10064.
doi: 10.1038/s41598-018-28107-4.

A selective high affinity MYC-binding compound inhibits MYC:MAX interaction and MYC-dependent tumor cell proliferation

Affiliations

A selective high affinity MYC-binding compound inhibits MYC:MAX interaction and MYC-dependent tumor cell proliferation

Alina Castell et al. Sci Rep. .

Abstract

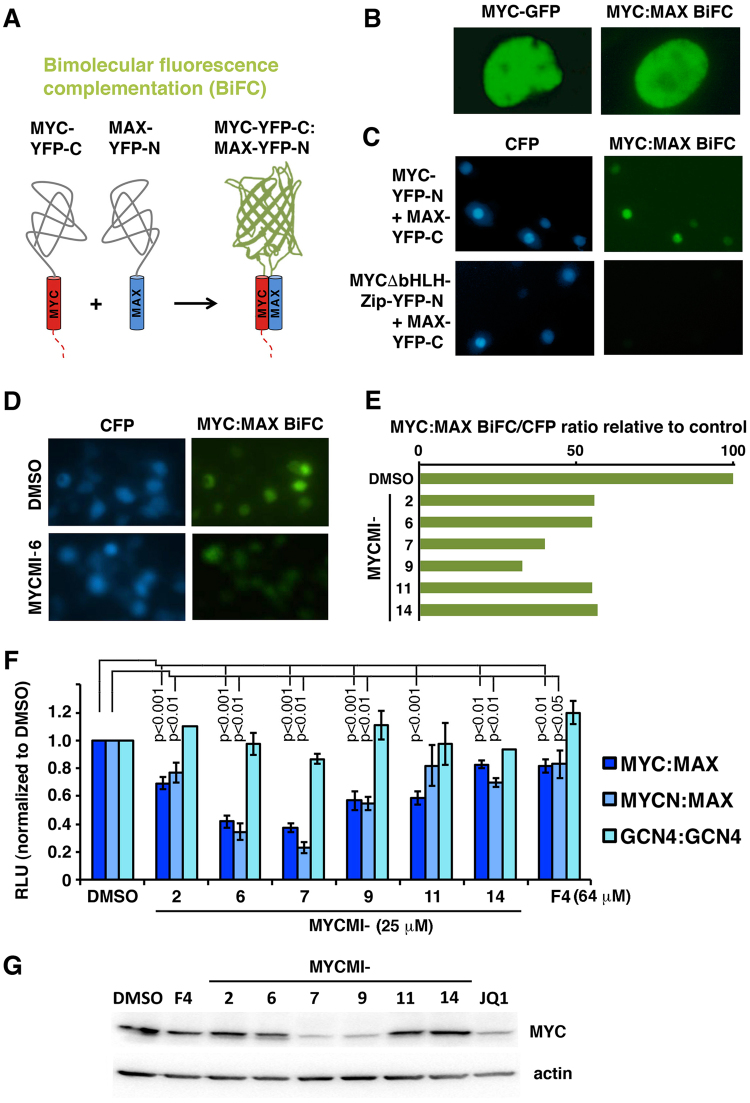
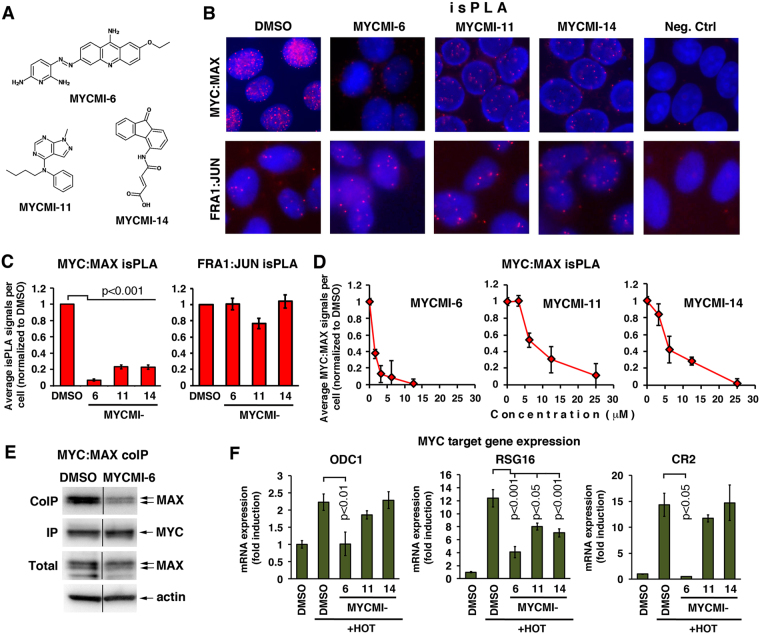
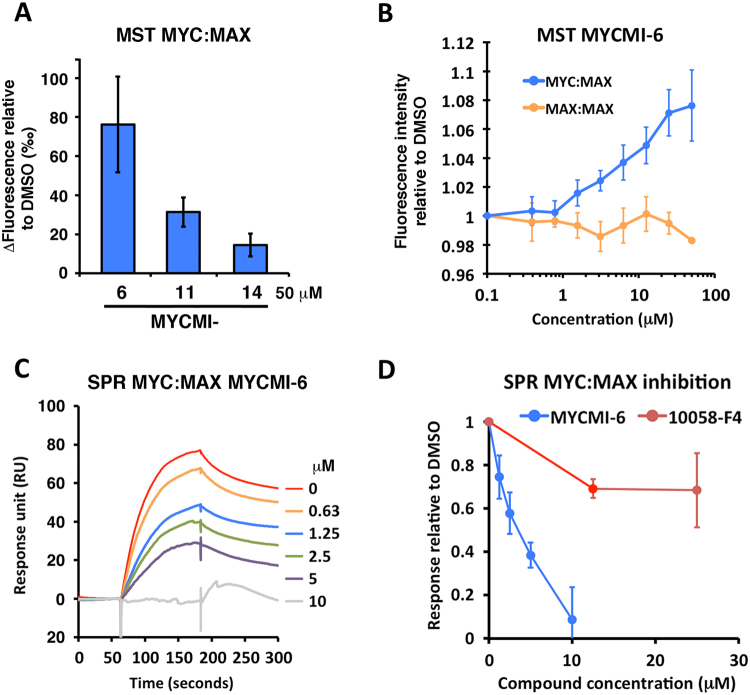
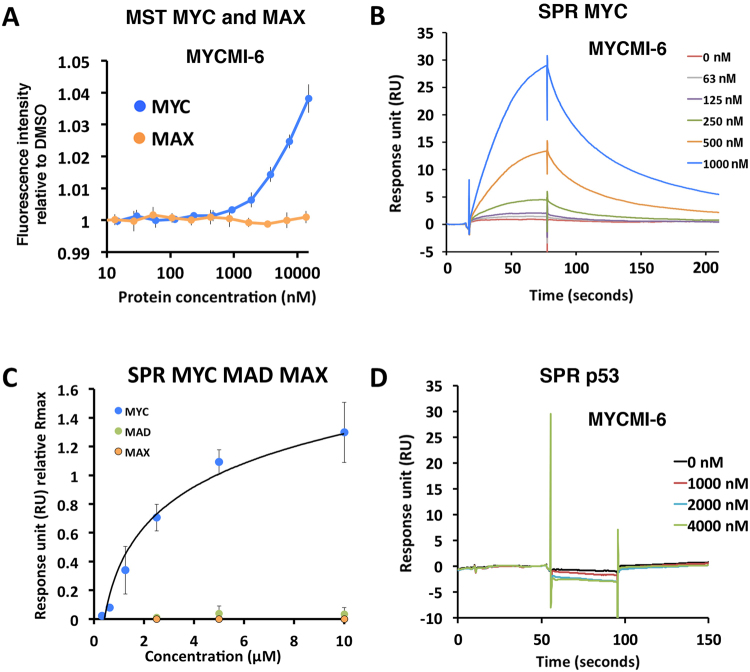
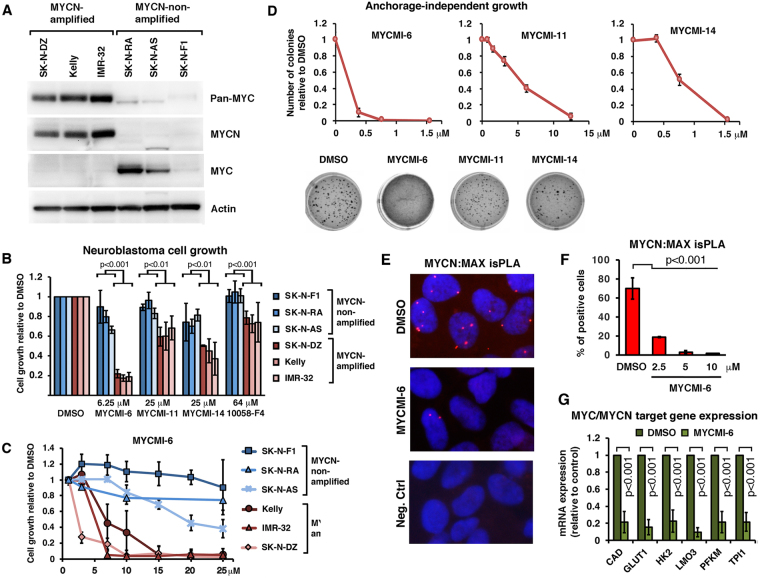
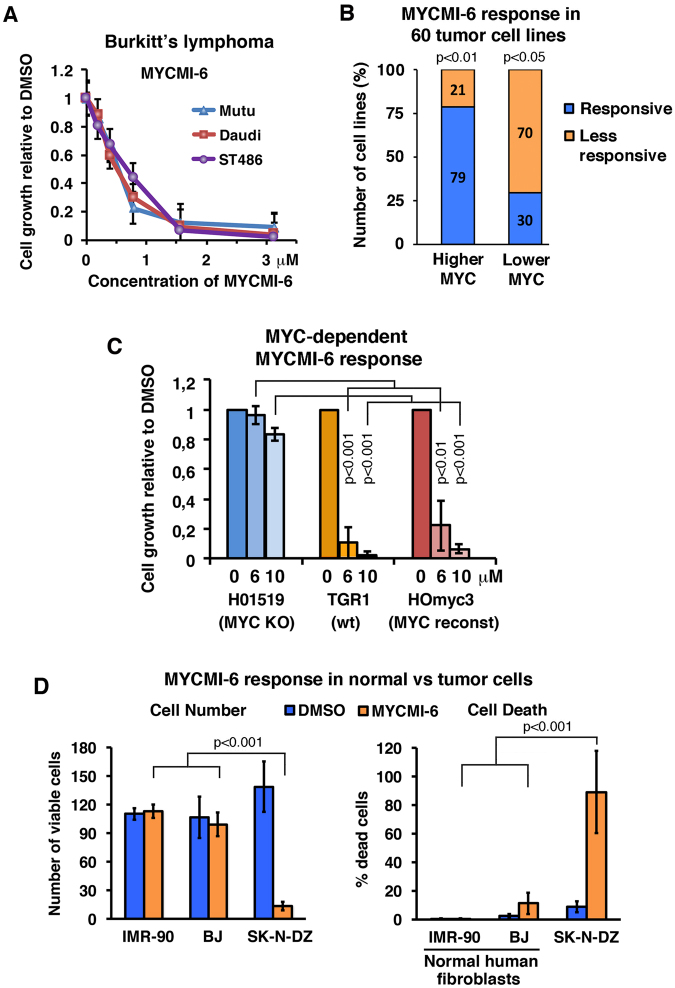
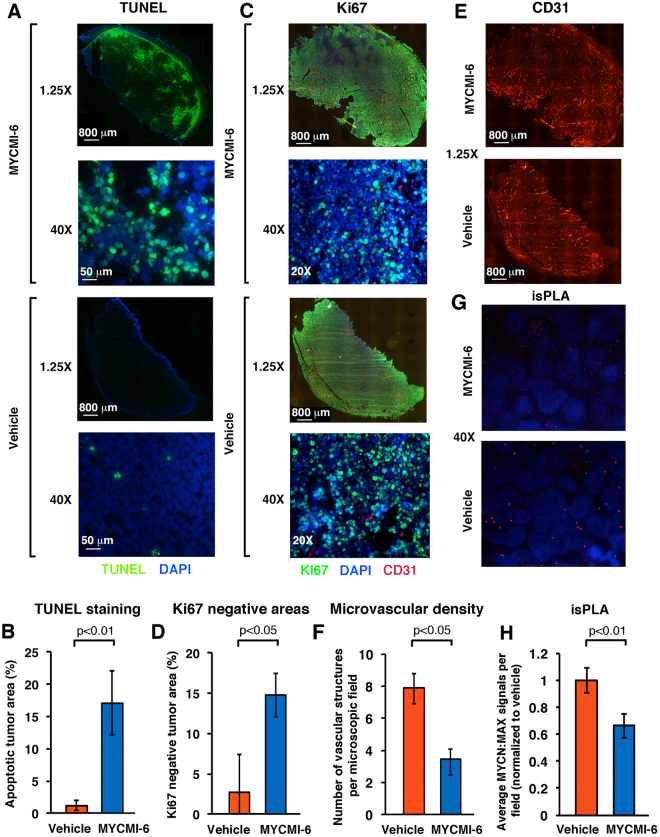
MYC is a key player in tumor development, but unfortunately no specific MYC-targeting drugs are clinically available. MYC is strictly dependent on heterodimerization with MAX for transcription activation. Aiming at targeting this interaction, we identified MYCMI-6 in a cell-based protein interaction screen for small inhibitory molecules. MYCMI-6 exhibits strong selective inhibition of MYC:MAX interaction in cells and in vitro at single-digit micromolar concentrations, as validated by split Gaussia luciferase, in situ proximity ligation, microscale thermophoresis and surface plasmon resonance (SPR) assays. Further, MYCMI-6 blocks MYC-driven transcription and binds selectively to the MYC bHLHZip domain with a KD of 1.6 ± 0.5 μM as demonstrated by SPR. MYCMI-6 inhibits tumor cell growth in a MYC-dependent manner with IC50 concentrations as low as 0.5 μM, while sparing normal cells. The response to MYCMI-6 correlates with MYC expression based on data from 60 human tumor cell lines and is abrogated by MYC depletion. Further, it inhibits MYC:MAX interaction, reduces proliferation and induces massive apoptosis in tumor tissue from a MYC-driven xenograft tumor model without severe side effects. Since MYCMI-6 does not affect MYC expression, it is a unique molecular tool to specifically target MYC:MAX pharmacologically and it has good potential for drug development.


Conflict of interest statement

The authors declare no competing interests.

Figures

Figure 1
Figure 1
Identification and validation of small molecules targeting the MYC:MAX protein interaction using a cell-based Bimolecular Fluorescence Complementation assay (BiFC). (A) Schematic representation of the principle of the BiFC assay. MYC and MAX were fused to two inactive fragments of YFP, generating MYC-YFP-C and MAX-YFP-N, respectively. Upon MYC:MAX heterodimerization, the two YFP fragments refold into a functional YFP protein. (B) Nuclear expression of MYC-eGFP (left panel) and MYC-YFP-C and MAX-YFP-N BiFC (right panel). (C) HEK293 cells cotransfected with the wt MYC-YFP-C or the MYCΔbHLHZip-YFP-C mutant (lacking the MAX-interacting bHLHZip region of MYC) and MAX-YFP-N BiFC constructs together with CMV-CFP used as internal reference. (D) Images of cells treated with compound MYCMI-6 (lower panel) or vehicle (upper panel). CFP channel (left panel) and YFP (BiFC) channel (right panel). (E) HEK293 cells cotransfected with MYC-YFP-C and MAX-YFP-N together with CMV-CFP and treated with NCI/DTP Diversity set library (25 μM of each compound) or vehicle (DMSO) for 24 hours in 96-well plates. The ratio of YFP/CFP was calculated relative to DMSO-treated cells. With a cut off of 40% inhibition, six hit compounds (MYCMIs) were identified (F) Effect of MYCMIs on MYC:MAX, MYCN:MAX and GCN4:GCN4 interactions using the Gaussia luciferase fragment complementation (GLuc) assay. The GLuc fusion protein constructs were transfected into the cells together with the CMV-Luc plasmid and treated with the indicated compounds for 17 hours and analyzed in a dual luciferase assay. The ratio of Gaussia/Firefly luciferase luminescence were calculated and normalized to DMSO-treated cells. Data are shown as mean ± standard deviation of 3–7 biological experiments each with 3–6 technical repeats. Significant p-values are indicated. (G) Western blot analysis of endogenous MYC expression in HeLa cells after 24 hours of treatment with the indicated MYCMIs (10 μM), the experimental MYC:MAX inhibitor 10058-F4 (64 μM) and the BET-inhibitor JQ1 (5 μM). Actin was used as loading control. Full length blots are presented in Suppl. Fig. S9A.
Figure 2
Figure 2
MYCMIs inhibit endogenous MYC:MAX interaction in breast cancer cells and repress MYC-induced target gene expression. (A) Chemical structures of MYCMI-6, MYCMI-11 and MYCMI-14. (BD) in situ Proximity Ligation Assay (isPLA). (B) Endogenous MYC:MAX (upper panel) and FRA1:JUN (lower panel) interactions visualized by isPLA as fluorescent red dots in cell nuclei (blue) after treatment with indicated compounds (10 μM) or DMSO for 16 hours. isPLA was performed using pairs of MYC and MAX and of FRA1 and JUN antibodies, respectively. As negative control, one primary antibody was used together with the pair of secondary antibodies. The isPLA results are based on three biological experiments for MYC:MAX and two for FRA1:JUN. One representative experiment for each is shown. (C) Quantification of MYC:MAX (left panel) and FRA1:JUN (right panel) isPLA, representing an average number of nuclear dots per cell from three microscopic fields normalized to corresponding values for DMSO-treated cells. p-values are indicated. (D) Titration of indicated compounds in MCF7 cells for 24 hours prior to MYC:MAX isPLA assay. Quantification was performed as in (C). (E) Coimmunoprecipitation of endogenous MAX with MYC from MDA-MB231 cells treated with 5 μM MYCMI-6 or DMSO for 3.5 hours. 1st–4th lanes from top; coimmunoprecipitated MAX, immunoprecipitated MYC, total levels of MAX and ACTIN, respectively, as determined by western blot analysis. Note that the gels have been cropped. The uncropped, full length versions are presented in Suppl. Fig. S9B. (F) Inhibition of MYC transactivation of target genes ODC1, RSG16, and CR2 as determined by RT-qPCR analysis, based on three biological experiments with three technical repeats each. U2OS-MYC-ER cells were treated with or without 100 nM 4-hydroxy-tamoxifen (HOT) for 4 hours, after which DMSO or indicated compounds (10 μM) were added for 24 hours before total RNA was extraction. Fold changes in mRNA expression are presented relative to DMSO in non-HOT-treated cells after normalization to GAPDH, used as reference gene. Significant p-values are indicated.
Figure 3
Figure 3
MYCMI-6 inhibits the MYC:MAX bHLHZip protein interaction in vitro. (A) Microscale thermophoresis (MST) of fluorescently labeled MAX in a MYC:MAX heterodimer formation assay based on recombinant proteins. 1 µM MYCbHLHZip was pre-incubated with 50 µM of respective MYCMI before mixing with 0.5–1 µM labeled MAXbHLHZip. MST was induced and the relative changes in fluorescence (thermophoresis of labeled MAX) to DMSO were analyzed and compared. (B) MST of labeled MAXbHLHZip after titration of MYCMI-6 pre-incubated with 1 µM MYCbHLHZip, or with 1 µM MAXbHLHZip. Fluorescence intensity of labeled MAXbHLHZip relative DMSO was plotted against MYCMI-6 concentration. 3–4 experiments were carried out each with technical duplicates. (C) Surface plasmon resonance (SPR) of MYC:MAX heterodimer formation assay. MAXbHLHZip was immobilized by an amino coupling procedure to a CM5 sensor chip. MYCbHLHZip pre-incubated with or without compound (as indicated) was injected over MAX for 180 seconds, allowed to dissociate for 240 seconds and regenerated. Reference surface (without MAXbHLHZip) subtracted sensorgrams are shown from one representative experiment. (D) SPR of MYC:MAX. Binding levels of MYCbHLHZip to MAXbHLHZip were analyzed and plotted against concentration of MYCMI-6, or 10058-F4, respectively. Three experiments were carried out, respectively.
Figure 4
Figure 4
MYCMI-6 binds selectively and with high affinity to the MYC bHLHZip domain. (A) MST assay measuring the effect of MYCMI-6 on MYC and MAX, respectively. Recombinant MYC bHLHZip and MAX bHLHZip proteins were titrated, respectively, in a fixed concentration (3 µM) of MYCMI-6. Changes in fluorescence were measured and normalized to control (buffer). Data are shown as mean ± standard deviation of 6–8 biological repeats. (B) SPR assay to determine the affinity of MYCMI-6 to MYC. MYC bHLHZip protein was immobilized by amino coupling on a CM5 sensor chip. MYCMI-6 was injected at various concentrations in a kinetic experiment. The reference surface was subtracted from the analyte surface to generate a sensorgram. Association and dissociation rates (ka = 9294 M−1 s−1, kd = 0.02293 s−1) were determined using the Langmuir 1:1 model in the Biacore Evaluation program fitting curves with a constant Rmax of 43 RU (theoretical Rmax), thereby suggesting a KD of 2.5 µM with a Chi2 value of 0.073. The sensorgram displays one representative experiment. Four kinetic experiments were carried out on two different sensor chips and an average KD of 1.6 ± 0.5 µM was calculated. (C) Four MYC equilibrium binding experiments with MYCMI-6 summarized in an equilibrium binding plot, carried out on two different sensor chips. Binding affinities were estimated from the plot as 50% of Rmax suggesting a KD of approximately 1.5–2 μM with an experimental Rmax of 25–30 RU (theoretical Rmax = 23 RU). SPR experiments of MYCMI-6 binding to immobilized MXD1 (MAD1) and MAX protein, respectively were included in the graph. Sensorgrams are shown in Suppl. Fig. S5A,C and D. (D) Reference subtracted sensorgram from the p53 protein SPR assay. p53 core protein was immobilized to 3000 RU and MYCMI-6 was injected at various concentrations (theoretical Rmax of 56 RU).
Figure 5
Figure 5
MYCMIs preferentially inhibit growth of MYCN-amplified compared to non-amplified neuroblastoma cells correlating with MYC family protein expression. (A) Western blot analysis of MYCN, MYC and pan-MYC protein expression in MYCN-amplified neuroblastoma cells (IMR-32, Kelly and SK-N-DZ) and MYCN-non-amplified neuroblastoma cells (SK-N-F1, SK-N-AS and SK-N-RA). Pan-MYC antibodies recognizing all MYC family proteins or antibodies specific for MYCN or MYC (see Supplementary Information), respectively, were used as indicated. Full length versions of the gels are presented in Suppl. Fig. S10. (B) Indicated neuroblastoma cell lines were treated with MYCMI-6 (6.25 μM), MYCMI-11 and MYCMI-14 (25 μM), reference compound 10058-F4 (64 μM) or DMSO control for 48 hours after which cell growth/viability was measured by the resazurin assay. Data are shown as mean ± standard deviation of 2–5 biological repeats. p-values are indicated. (B) Titration of MYCMI-6 onto three MYCN-non-amplified and three MYCN-amplified cell lines as indicated for 48 hours followed by the resazurin assay. (C and D) Anchorage-independent cell growth of MYCN-amplified neuroblastoma cells. (C) Anchorage-independent growth of neuroblastoma SK-N-DZ cells in 0.35% agarose in 24 well plates in the presence of DMSO or compounds at indicated concentrations. After 16 days, colonies were stained with MTT and the numbers of colonies were counted. Images of colonies in wells treated with 0.75 μM of compound, analyzed after two weeks, are displayed (lower panel). (E and F), visualization of endogenous MYCN:MAX interaction by isPLA in MYCN-amplified SK-N-BE(2) cells, performed as described in the legend to Fig. 2 using MYCN and MAX antibodies. (E) Images of the isPLA assay. The cells were treated with MYCMI-6 (2.5 µM) or DMSO for 16 hours. As negative control, one primary antibody was used together with the pair of secondary antibodies. (F) Quantification of MYCN:MAX isPLA, representing the average percentage of cells displaying MYCN:MAX nuclear dots from three microscopic fields after treatment with MYCMI-6 at indicated concentrations for 16 hours normalized to corresponding values for DMSO-treated cells. p-values are indicated. (G) RT-qPCR analysis of mRNA expression of selected MYC/MYCN target genes, in MYCN-amplified Kelly cells after treatment with MYCMI-6 (2.5 μM) or DMSO for 24 hours. The analysis is based on three biological experiments with three technical repeats each. Fold changes in mRNA expression in response to MYCMI-6 are presented relative to DMSO after normalization to total RNA per cell. p-values are indicated.
Figure 6
Figure 6
MYCMI-6 inhibits tumor cell growth and viability in a MYC-dependent manner but is not cytotoxic to primary normal human cells. (A) MYCMI-6 titration on Burkitt’s lymphoma (BL) cell lines Mutu, Daudi and ST486. Data are shown as mean ± standard deviation of 2 biological experiments, each with 3 technical repeats. (B) Correlation MYCMI-6 response (GI50) with MYC mRNA levels of the NCI-60 human tumor cell lines extracted from CellMiner™ and complemented with MYC protein levels from the Novartis proteome scout project or from the literature (see Supplementary Table S1). “Responsive” and “less responsive”; cell lines with positive and negative log 10 GI50 values, respectively. “Higher MYC” and “lower MYC”; cell lines with higher and lower MYC expression levels (MYC mRNA/protein) than average, respectively. p-values are indicated. (C) Growth of TGR-1 (wt), HO15.19 (MYC knockout) and HOmyc3 (MYC reconstituted HO15.19) Rat1 fibroblasts, as measured by the WST-1 assay after treatment with MYCMI-6. Data are shown as mean ± standard deviation of 3–5 biological experiments, each with 3 technical repeats. p-values are indicated. (D) Normal IMR-90 and BJ human fibroblasts and the MYCN-amplified neuroblastoma cell line SK-N-DZ were treated with 12.5 μM MYCMI-6 or control (DMSO) for 24 hours. The number of viable and percentage of dead cells were quantified by addition of CellTracker Green (stains all cells) and DAPI (stains dead cells) to cells and analyzed in GFP and CFP channels using a fluorescence microscope. p-values are indicated.
Figure 7
Figure 7
MYCMI-6 inhibits MYC:MAX interaction, induces apoptosis and reduces tumor cell proliferation and microvascularity in a MYCN-amplified neuroblastoma mouse tumor model in vivo. SK-N-DZ MYCN-amplified neuroblastoma xenograft tumors reaching a volume of 100–200 mm3 were treated with MYCMI-6 (20 mg/kg body weight) or vehicle injected i.p. daily for 1–2 weeks. (A) Apoptosis was determined by TUNEL staining (green) of tumor tissues from mice treated with MYCMI-6 (upper two panels) or vehicle (lower two panels), counterstained with DAPI (blue). Representative images are shown at 1.25X (panel 1 and 3 from top, bar = 800 μM) or 40X (panel 2 and 4, bar = 50 μM) magnification. (B) Quantification of TUNEL staining normalized to whole tumor areas as determined by DAPI from three MYCMI-6- and three vehicle-treated mice. (C) Cell proliferation and microvascular density determined by Ki67 (green) and CD31 (red) staining, respectively, of tumor tissues from mice treated with MYCMI-6 (upper two panels) or vehicle (lower two panels), respectively, and counterstained with DAPI (blue). Representative images taken at 1.25X (panel 1 and 3 from top, bar = 800 μM) or 20X (panel 2 and 4) magnification. (D) Quantification of Ki67 negative areas normalized to whole tumor areas by DAPI from three MYCMI-6- and three vehicle-treated mice. (E) microvascular density visualized by CD31 staining in the red channel at 1.25X magnification as in (C). (F) Quantification of CD31 staining normalized to whole tumor areas from three MYCMI-6- and three vehicle-treated mice. (G) Detection of MYCN:MAX protein interaction by isPLA performed on tumor tissue from mice treated with MYCMI-6 (upper panel) or vehicle (middle panel) using antibodies against MYCN and MAX. Representative images were taken at 40X magnification. (H) Quantification of MYCN:MAX isPLA signals in tumor tissue from MYCMI-6- and vehicle-treated mice, presented as average number of dots from four randomly chosen microscopic fields from MYCMI-6 treated mice normalized to corresponding values from vehicle-treated mice. SEM and p-values are indicated.

References

    1. Blackwood EM, Eisenman RN. Max: a helix-loop-helix zipper protein that forms a sequence-specific DNA-binding complex with Myc. Science. 1991;251:1211–1217. doi: 10.1126/science.2006410. - DOI - PubMed
    1. Dang CV. MYC on the path to cancer. Cell. 2012;149:22–35. doi: 10.1016/j.cell.2012.03.003. - DOI - PMC - PubMed
    1. Eilers M, Eisenman RN. Myc’s broad reach. Genes Dev. 2008;22:2755–2766. doi: 10.1101/gad.1712408. - DOI - PMC - PubMed
    1. Larsson LG, Henriksson MA. The Yin and Yang functions of the Myc oncoprotein in cancer development and as targets for therapy. Exp Cell Res. 2010;316:1429–1437. doi: 10.1016/j.yexcr.2010.03.025. - DOI - PubMed
    1. Meyer N, Penn LZ. Reflecting on 25 years with MYC. Nat Rev Cancer. 2008;8:976–990. doi: 10.1038/nrc2231. - DOI - PubMed

Publication types

MeSH terms