. 2018 Jul 3;8(1):10068.
doi: 10.1038/s41598-018-28273-5.

Striatonigral neurons divide into two distinct morphological-physiological phenotypes after chronic L-DOPA treatment in parkinsonian rats

Affiliations

Striatonigral neurons divide into two distinct morphological-physiological phenotypes after chronic L-DOPA treatment in parkinsonian rats

T Fieblinger et al. Sci Rep. .

Abstract

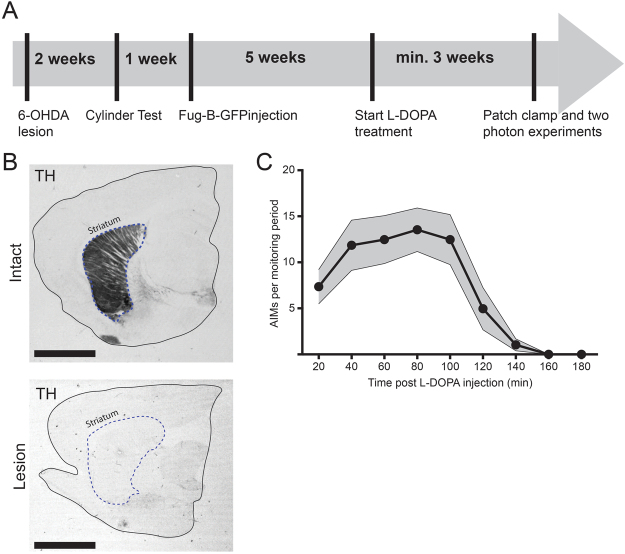
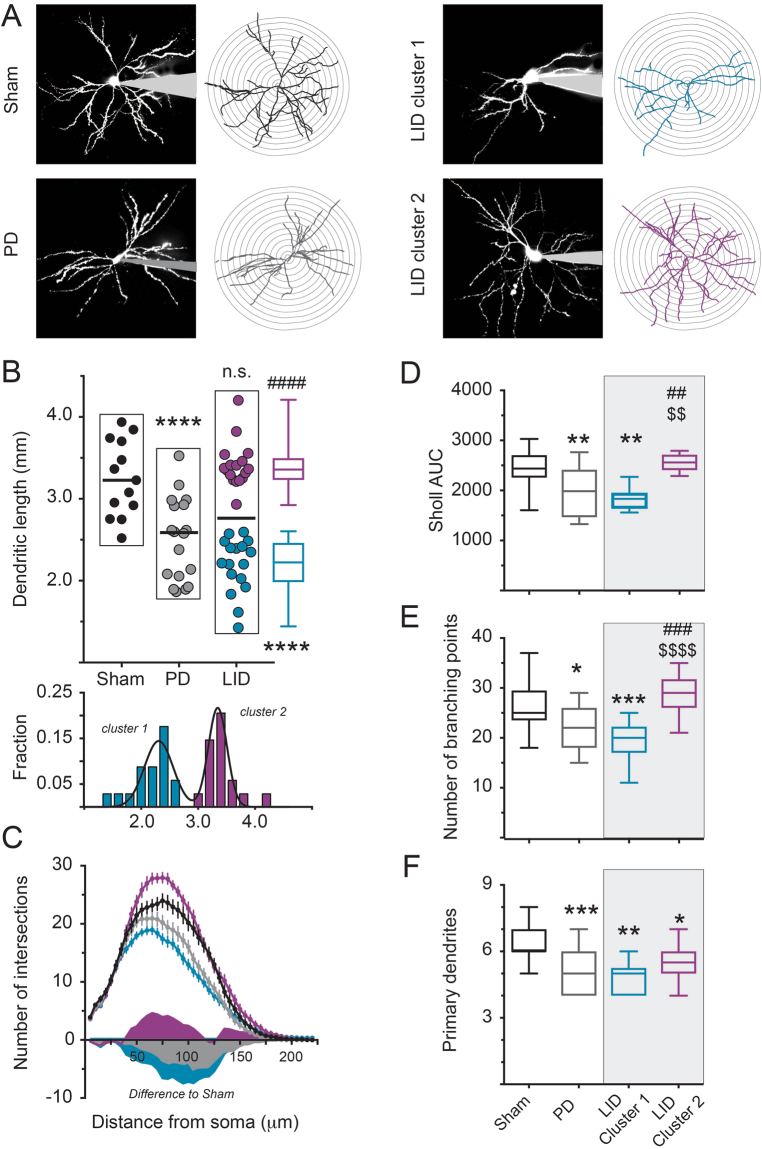
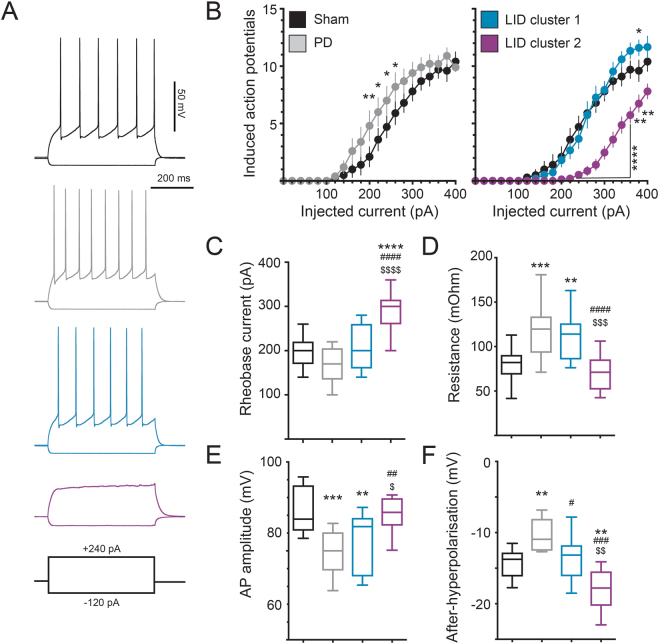
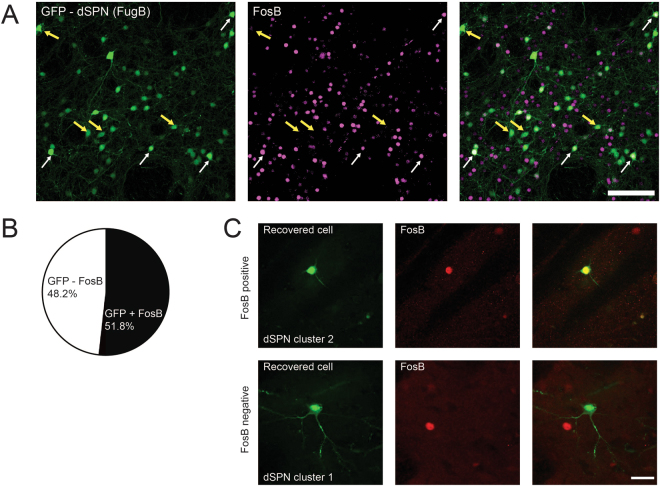
Dendritic regression of striatal spiny projection neurons (SPNs) is a pathological hallmark of Parkinson's disease (PD). Here we investigate how chronic dopamine denervation and dopamine replacement with L-DOPA affect the morphology and physiology of direct pathway SPNs (dSPNS) in the rat striatum. We used a lentiviral vector optimized for retrograde labeling (FuG-B-GFP) to identify dSPNs in rats with 6-hydroxydopamine (6-OHDA) lesions. Changes in morphology and physiology of dSPNs were assessed through a combination of patch-clamp recordings and two photon microscopy. The 6-OHDA lesion caused a significant reduction in dSPN dendritic complexity. Following chronic L-DOPA treatment, dSPNs segregated into two equal-sized clusters. One group (here called "cluster-1"), showed sustained dendritic atrophy and a partially normalized electrophysiological phenotype. The other one ("cluster-2") exhibited dendritic regrowth and a strong reduction of intrinsic excitability. Interestingly, FosB/∆FosB induction by L-DOPA treatment occurred preferentially in cluster-2 dSPNs. Our study demonstrates the feasibility of retrograde FuG-B-GFP labeling to study dSPNs in the rat and reveals, for the first time, that a subgroup of dSPNs shows dendritic sprouting in response to chronic L-DOPA treatment. Investigating the mechanisms and significance of this response will greatly improve our understanding of the adaptations induced by dopamine replacement therapy in PD.


Conflict of interest statement

The authors declare no competing interests.

Figures

Figure 1
Figure 1
Experimental outline. (A) Time course of the experiment. Rats were injected with 6-OHDA and screened for forelimb use asymmetry two weeks later. After one additional week, FuG-B-GFP viral vector was injected into the substantia nigra pars reticulata, and ex vivo experiments started earliest eight weeks after. Daily L-DOPA treatment started six weeks after 6-OHDA lesion and lasted 3–4 weeks. (B) Representative tyrosine hydroxylase staining (TH). Near-complete elimination of TH in the striatum in the hemisphere ipsilateral to the toxin injection was documented for all animals in this study. Scale bars: 0.5 cm (C) Representative plot of AIM scores post L-DOPA injection for a testing session after three weeks of treatment (n = 7).
Figure 2
Figure 2
FuG-B lentiviral labelling of ‘classical’ dSPNs in rat and mouse. (A) Overview image of a sagittal rat brain section. GFP-positive cells are found throughout the striatum, but to lesser extent also in the cortex. Scale bar: 0.5 cm (B) Low magnification confocal image of a coronal brain section shows FuG-B-GFP-labeled cells throughout striatum. Scale bar: 500 μm. (C) Co-labeling shows that these FuG-B-GFP positive cells in the rat striatum are positive for DARPP-32, a marker of SPNs. Scale bar: 25 μm. (D) We found 98.7% of co-labelling of FuG-B-GFP and strong tdTomato fluorescence after injecting the same vector in transgenic BAC-drd1a-tdTomato mice (n = 152 cells in 6 mice). Scale bars: 25 μm.
Figure 3
Figure 3
Dendritic reconstructions reveal two morphologically distinct clusters of dSPNs in dyskinetic rats. (A) Examples of 3D reconstructed neurons. Maximum intensity projections of patch-filled dSPNs are shown paired with the corresponding reconstructions. (B) After L-DOPA treatment, dSPNs segregate into two cluster. Total dendritic length is significantly decreased in experimental parkinsonism (n = 13 and 18). However, pooled dSPNs in LID were not significantly different from neither sham nor PD group (n = 34). Closer inspection reveals that these neurons split into two clusters (each n = 17). Similar to neurons in the PD group (gray), cluster-1 dSPNs (blue) display significant atrophy. However, cluster-2 dSPNs (magenta) show significantly increased dendritic length compared to the PD group and are not different from control cells (black). The histogram of the LID group dSPNs shows that the distribution is indeed best fit as a sum of two gaussian functions, with two separate peaks. (C) Sholl analysis shows a loss of dendritic intersections at various distances from the soma for both PD group and cluster-1. Cluster-2 dSPNs, however, displays even more intersections than control cells in the mid-distance from the soma. (D) The area under the curve (AUC), as calculated from the Sholl analysis, confirms dendritic atrophy in cells of the PD group and LID cluster-1 dSPNs. Conversely, cluster-2 dSPNs are not significantly different from neurons in the sham group. (E) While the number of dendritic branching points is reduced in both PD group and cluster-1 dSPNs, it is indistinguishable from sham in cluster-2 dSPNs. (F) The number of primary dendrites was reduced in all cells as compared to sham. *,**,***p < 0.05/0.01/0.001 vs. sham; ##,###,####p < 0.01/0.001/0;0001 vs. PD; $$,$$$$ p < 0.01/0.0001 vs. cluster-1 (Tukey’s multiple comparison test).
Figure 4
Figure 4
Electrophysiological properties confirm the separation into two subpopulations of dSPNs in LID. (A) Example recordings for all groups of neurons are shown. Each trace depicts the voltage change in response to a hyper- (−120 pA) and a depolarizing (240 pA) current injection. Note that this depolarizing current is sufficient to induce action potential firing in sham, PD and cluster-1 dSPNs, however not in cluster-2 dSPNs. (B) Plotting the evoked action potentials over the injected current shows a slight left shift in the PD curve towards a more excitable state (left diagram, n = 13 and 18). The curve for cluster-1 dSPNs is nearly indistinguishable from the one of sham neurons (right diagram, n = 17). However, cluster-2 dSPNs showed a clear decrease in excitability and a shift to the right (n = 17). (C) This dramatic shift in excitability of cluster-2 dSPNs is also represented in the significant increase of the rheobase current. (D) Input resistance is increased in the same way for both, neurons in the PD group and cluster-1 dSPNs. However, input resistance decreased to sham levels in cluster-2 dSPNs. (E) Action potential amplitude also dropped in the cells from PD rats and was not altered in cluster-1 dSPNs. Values for cluster-2 dSPNs were however increased and not different from sham levels. (F) The after-hyperpolarization decreased with DA-denervation and was partially restored in cluster-1 dSPNs. Cluster-2 dSPNs showed a clearly stronger after-hypoerpolarizion than cluster-1 dSPNs, PD and even sham group. *,**,***,****p < 0.05/0.01/0.001/0.0001 vs. sham, ##,###,####p < 0.01/0.001/0.0001 vs. PD, $,$$,$$$,$$$$p < 0.05/0.01/0.001/0.0001 vs. cluster-1 dSPNs (Tukey’s multiple comparison test).
Figure 5
Figure 5
FosB/∆FosB expression in FuG-B-GFP labeled SPNs. (A) Striatal sections containing FuG-B-GFP labeled cells (green) were co-stained for FosB/∆FosB (magenta). Approximately half of the GFP-positive cells showed clear staining for FosB/∆FosB (white arrows), whereas the other half did not (yellow arrows). Scale bar: 100 μm. (B) Analysis of n = 873 GFP neurons from 5 rats established that 51.8% of the retrogradely labeled dSPNs also expressed FosB-like immunoreactivity. (C) Some cells that were used for patch clamp and 2PLSM experiments were recovered in fixed slices based on their expression of an Alexa dye. Slices were sectioned and immunostained for FosB/∆FosB. The examples show a cluster-2 dSPN with clear nuclear immunostaining (upper row) and a cluster-1 dSPN that is clearly FosB-negative (lower row). Scale bar: 25 μm.

Similar articles

Cited by

References

    1. Albin RL, Young AB, Penney JB. The functional anatomy of basal ganglia disorders. Trends Neurosci. 1989;12:366–375. doi: 10.1016/0166-2236(89)90074-X. - DOI - PubMed
    1. Graybiel AM. Neurotransmitters and neuromodulators in the basal ganglia. Trends Neurosci. 1990;13:244–254. doi: 10.1016/0166-2236(90)90104-I. - DOI - PubMed
    1. Fieblinger T, et al. Cell type-specific plasticity of striatal projection neurons in parkinsonism and L-DOPA-induced dyskinesia. Nat Commun. 2014;5:5316. doi: 10.1038/ncomms6316. - DOI - PMC - PubMed
    1. Cazorla M, Kang UJ, Kellendonk C. Balancing the Basal Ganglia Circuitry: A Possible New Role for Dopamine D2 Receptors in Health and Disease. Mov Disord. 2015;30:895–903. doi: 10.1002/mds.26282. - DOI - PMC - PubMed
    1. Calabresi P, Picconi B, Tozzi A, Ghiglieri V, Di Filippo M. Direct and indirect pathways of basal ganglia: a critical reappraisal. Nat Neurosci. 2014;17:1022–1030. doi: 10.1038/nn.3743. - DOI - PubMed

Publication types