. 2018 Jul 3;8(1):10004.
doi: 10.1038/s41598-018-28296-y.

Spermine increases acetylation of tubulins and facilitates autophagic degradation of prion aggregates

Affiliations

Spermine increases acetylation of tubulins and facilitates autophagic degradation of prion aggregates

Kanchan Phadwal et al. Sci Rep. .

Abstract

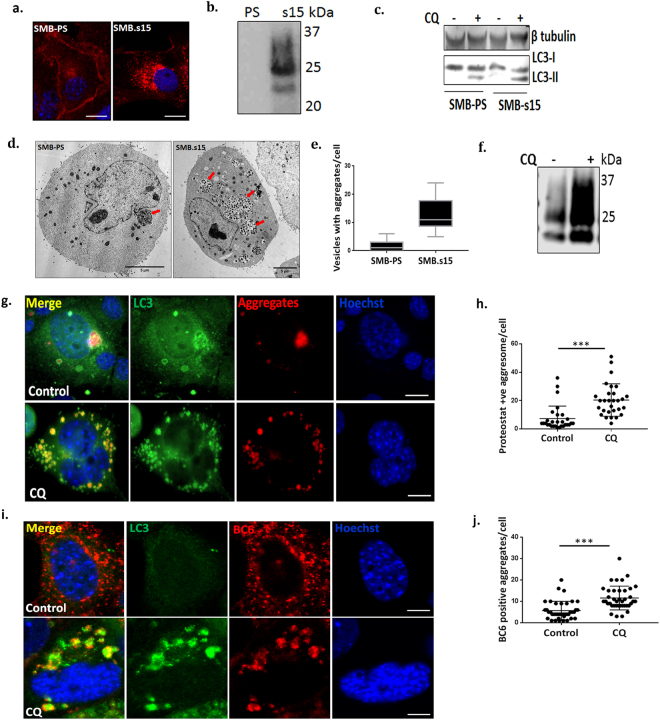
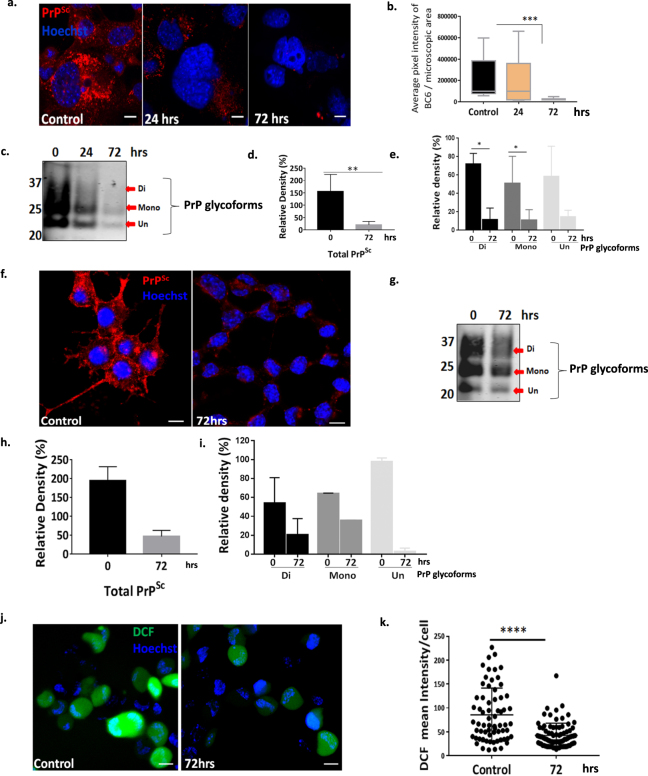
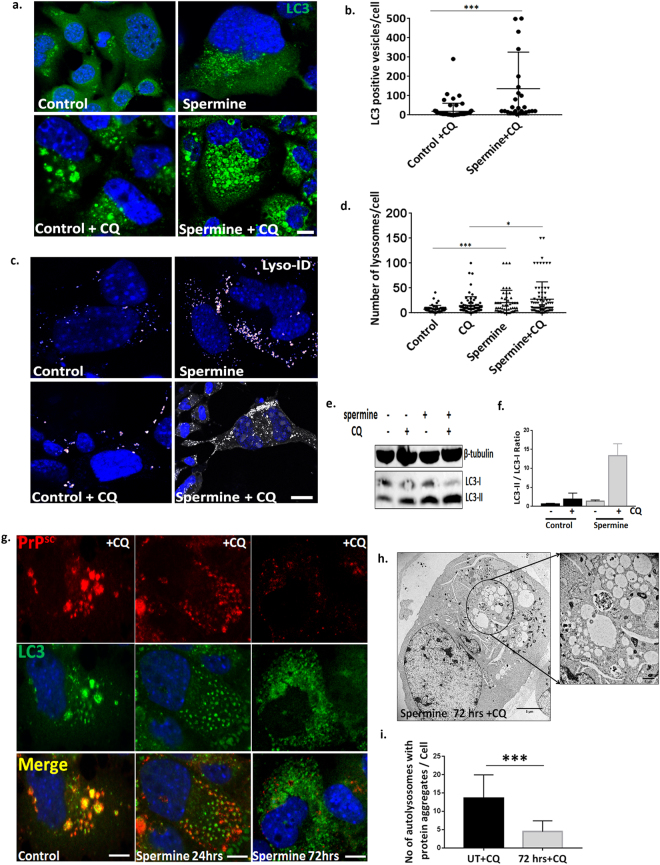
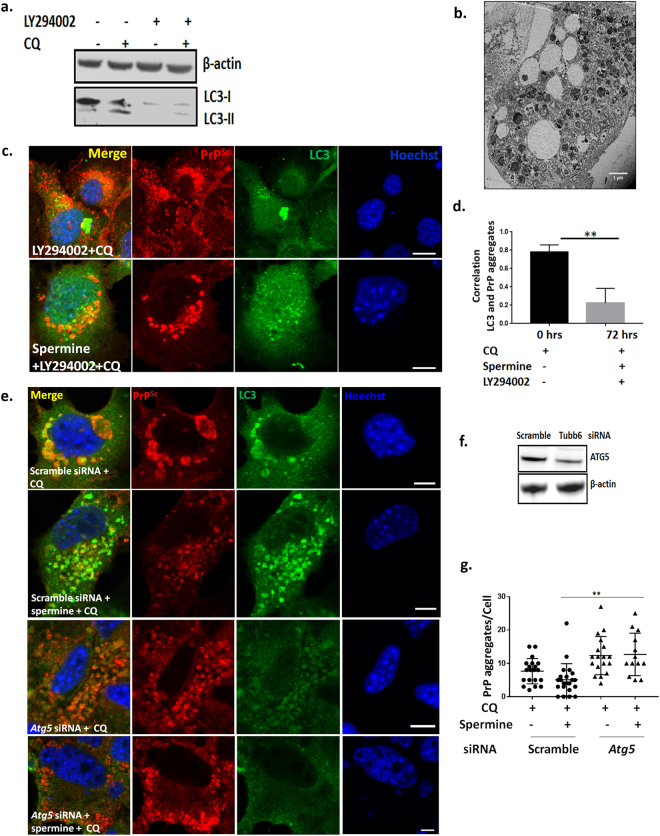
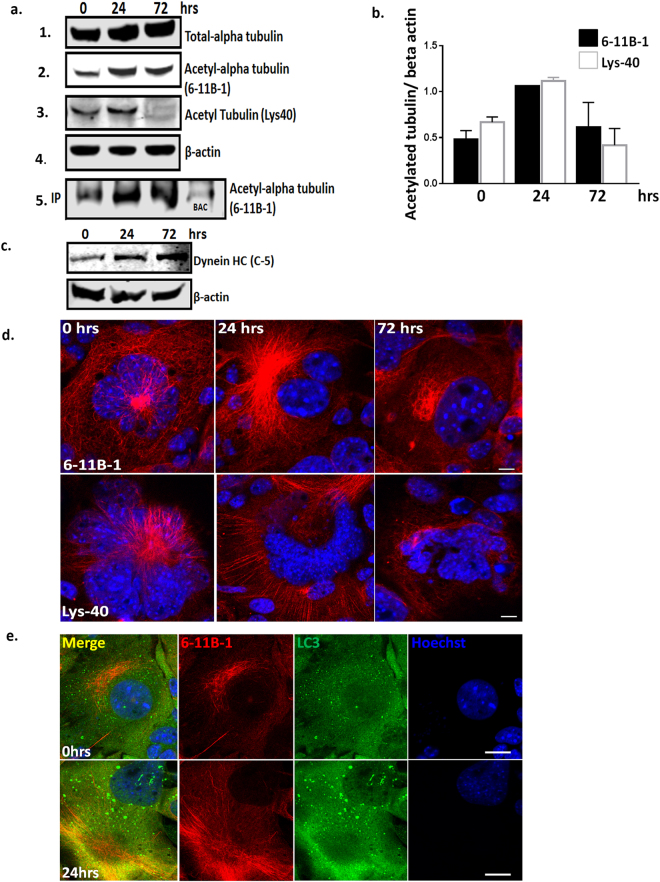
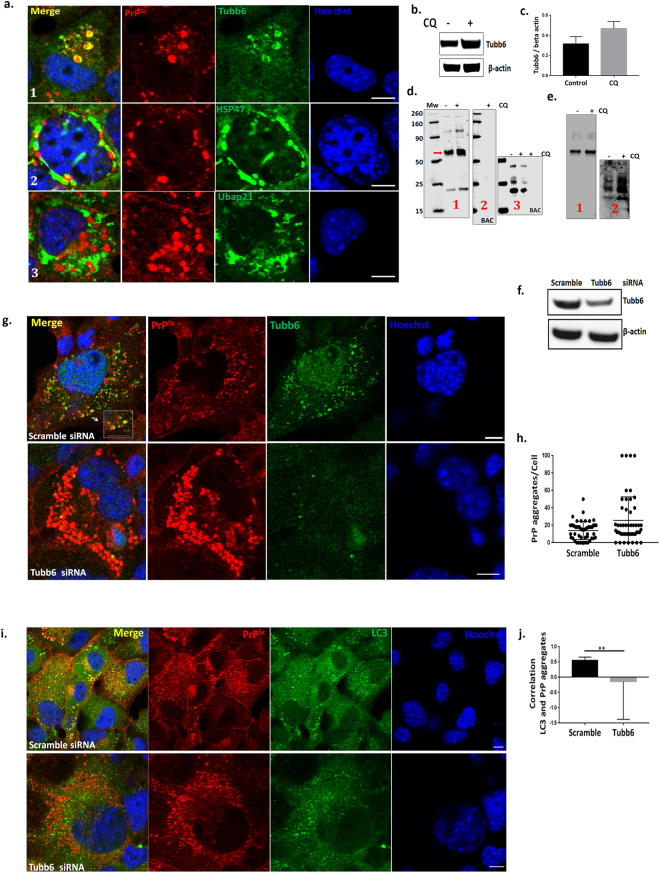
Autolysosomal dysfunction and unstable microtubules are hallmarks of chronic neurodegenerative diseases associated with misfolded proteins. Investigation of impaired protein quality control and clearance systems could therefore provide an important avenue for intervention. To investigate this we have used a highly controlled model for protein aggregation, an in vitro prion system. Here we report that prion aggregates traffic via autolysosomes in the cytoplasm. Treatment with the natural polyamine spermine clears aggregates by enhancing autolysosomal flux. We demonstrated this by blocking the formation of mature autophagosomes resulting in accumulation of prion aggregates in the cytoplasm. Further we investigated the mechanism of spermine's mode of action and we demonstrate that spermine increases the acetylation of microtubules, which is known to facilitate retrograde transport of autophagosomes from the cellular periphery to lysosomes located near the nucleus. We further report that spermine facilitates selective autophagic degradation of prion aggregates by binding to microtubule protein Tubb6. This is the first report in which spermine and the pathways regulated by it are applied as a novel approach towards clearance of misfolded prion protein and we suggest that this may have important implication for the broader family of protein misfolding diseases.


Conflict of interest statement

The authors declare no competing interests.

Figures

Figure 1
Figure 1
Prion aggregates traffic via autolysosomes in SMB.s15 cells. All the experiments were performed either with or without 10 μM CQ. (a) Immunofluorescence staining using anti PrP antibody BC6 in SMB-PS and SMB.s15 cells (N = 3). (b) Representative immunoblot shows PK resistant PrPSc in SMB.s15 cells (N = 2). (c) Representative immunoblot for LC3 and β-tubulin in SMB-PS and SMB.s15 cells, lane 2 & 4 were treated with CQ (N = 3). (d) Representative TEM images of SMB-PS and SMB.s15 after CQ treatment, red arrows indicate vesicles with aggregates (N = 2). (e) Increased number of vesicles with aggregates in SMB.s15 cells. All SMB.PS cells imaged with TEM showed minimal aggregates (0–5/cell) whereas all SMB.s15 cells images showed increased number of aggregates (5–24/cell). (f) WB for PK resistant PrPSc after CQ treatment in SMB.s15 cells (N = 3). (g) Representative image of proteostat dye (aggregates) and LC3 immunofluorescence staining of SMB.s15 cells after CQ treatment compared to untreated control cells (N = 3). (h) Significantly increased LC3 stained proteostat positive aggregates in SMB.s15 cells on CQ treatment. (i) Representative image of PrPSc and LC3 immunofluorescence staining of SMB.s15 cells after CQ treatment compared to untreated control cells (N = 5). (j) Significantly increased LC3 stained PrPSc aggregates in SMB.s15 cells on CQ treatment. Scale bar = 10 μm. Respective full length blots are shown in Supplementary Fig. 3. Abbreviations used Chloroquine (CQ), Transmission Electron Microscopy (TEM), proteinase K (PK).
Figure 2
Figure 2
Spermine treatment clears prion aggregates in SMB and CAD cells terminally differentiated into neurons and reduces ROS in CAD cells. SMB.s15 and CAD22L cells were treated with 5 μM spermine for the mentioned period. (a) Representative immunofluorescence images showing reduced PrPSc staining after 24 and 72 hrs of spermine treatment in SMB.s15 cells (N = 3). (b) Significantly reduced pixel intensity of PrPSc in immunofluorescence images on 72 hrs spermine treatment in SMB.s15 cells. (c) Proteinase-K treated lysates immunoblotted for PrPSc after 0, 24 and 72 hrs of treatment with spermine in SMB.s15 cells (N = 3). (d) Significantly reduced relative density of total PrPSc after 72 hrs of spermine treatment. (e) Significantly reduced relative density of di- and mono- glycosylated forms of PrPSc after 72 hrs of spermine treatment. (f) CAD22L cells showing reduced immunofluorescence for PrPSc after 72 hrs of spermine treatment (N = 2). (gi) Reduced expression of total PrPSc and PrPSc glycoforms in CAD22L cells, after 72 hrs of spermine treatment (N = 2). PrPSc glycoforms are shown with red arrows. (j) Reduced DCF fluorescence in CAD22L cells after 72 hrs of spermine treatment (N = 2). (k) Significantly reduced DCF mean intensity in CAD22L cells. Scale bar = 10 μm. Respective full length blots are shown in Supplementary Fig. 3. Abbreviations used: Chloroquine (CQ), Transmission Electron Microscopy (TEM), Dichlorofluorescein (DCF).
Figure 3
Figure 3
Spermine clears prion aggregates by enhancing autolysosomal flux. SMB.s15 cells were either left untreated or treated with 10 μM CQ or treated with 5 μM Spermine alone or 5 μM Spermine and 10 μM of CQ for 24 hrs. (a) Representative images showing increased number of LC3 positive vesicles on spermine treatment (N = 3). (b) Significantly increased LC3 positive vesicles on spermine + CQ treatment compared to control + CQ treatment. (c) Representative images of increased number of Lyso-ID positive lysosomes on spermine treatment (N = 3). (d) Significantly increased lysosomes on spermine treatment. (e) Representative immunoblot to show increased conversion of LC3I to LC3II on spermine and CQ treatment (lanes 3, 4) compared to untreated cells (Lanes 1, 2) (N = 3). (f) Quantification of LC3II/ LC3I ratio as a marker of autophagic flux. SMB.s15 cells were treated with 5 μM spermine for 0, 24 and 72 hrs and 10 μM of CQ was given 16 hrs before the end point of spermine treatment to visualise the autolysosomes. (g) Representative immunofluorescence images of SMB.s15 cells stained for PrPSc and LC3 antibodies (N = 3). (h) Representative TEM image after 72  hrs of spermine treatment showing vesicles with reduced aggregates, area inside the circle is enlarged to show the vesicles (N = 2). (i) Vesicles with significantly reduced PrPSc aggregates on 72 hrs of spermine treatment. Scale bar for confocal images = 10 μm. Respective full length blots are shown in Supplementary Fig. 3. Abbreviations used: Chloroquine (CQ), Transmission Electron Microscopy (TEM).
Figure 4
Figure 4
Blocking formation of active autophagosomes with PI3K inhibitor LY294002 and Atg5 siRNA leads to failure of clearance of prion aggregates. SMB.s15 cells were treated with 40 μM PI3K inhibitor LY294002 for 16 hrs to block the formation of autophagosomes. (a) Representative immunoblot to show reduced LC3-I and LC3-II after LY294002 treatment, lane 3 and 4. (b) Representative TEM image showing aggregates scattered in the cytoplasm with empty vesicles after treatment with 5 μM spermine for 72 hrs, LY294002 and 10 μM CQ for the last 16 hrs. (c). Representative immunofluorescence images showing reduced colocalisation of LC3 with PrPSc aggregates after treatment with 5 μM spermine for 72 hrs, LY294002 and 10 μM CQ for the last 16 hrs. (d) Significantly reduced colocalisation between LC3 and PrPSc aggregates on LY294002 treatment. For the Atg5 siRNA treatment, the cells with either treated with 10 μM of CQ or 5 μM spermine and10μM of CQ for 24 hrs post transfection. (e) Representative immunofluorescence images showing reduced LC3 punctae and increased prion aggregates on treatment with Atg5 siRNA when compared to scrambled control siRNA. Treatment with spermine does not reduce the number of aggregates after Atg5 siRNA treatment (last lane). (f) Western blot to show reduced Atg5 expression on treatment with Atg5 siRNA when compared to scrambled control siRNA and the loading control β- actin. (g) Graph showing a significant increase in the number of PrP aggregates on spermine treatment post Atg5 siRNA treatment compared to spermine treated cells from scramble control siRNA. N = 2, Scale bar = 10 μm. Respective full length blots are shown in Supplementary Fig. 3. Abbreviations used: Chloroquine (CQ), Transmission Electron Microscopy (TEM).
Figure 5
Figure 5
Spermine increases the acetylation of proteins involved in retrograde transport. SMB.s15 cells were treated with 5 μM Spermine for 0, 24 and 72 hrs; cytoplasmic extracts were used both for immunoprecipitation (IP) with anti-acetyl lysine antibody and run on WB or run directly on WB. (a) Immunoblotting with total alpha tubulin (lane1), two different acetyl-alpha tubulin antibodies (6–11B-1 and Lys40) show increased expression (lane 2 and 3) after 24 hrs spermine treatment, and loading control β-actin (lane 4) both from the cytoplasmic extract as well as from the immunoprecipitation product after IP with acetyl-lysine antibody (lane 5), BAC (lane 5 last row) (b) Graph showing relative expression levels of 6-11B-1 and Lys40 compared to β-actin. (c) WB shows increased expression of approx. 500 kDa Dynein-HC after 24 and 72 hrs of spermine treatment (d) Representative images with acetyl-alpha antibodies (6-11B-1, first lane) (Lys40, second lane) show increased expression on 24 hrs spermine treatment. (e) Representative images with increased colocalisation of bright LC3 punctae with acetyl-alpha antibody (6-11B-1) after 24 hrs spermine treatment. Scale bar = 10 μm, N = 3 for LC-MS, N = 2 for WB and immunofluorescence. Respective full length blots are shown in Supplementary Fig. 3. Abbreviations used: Immunoprecipitation (IP), Western blot (WB), Beads Alone Control (BAC), Liquid chromatography–mass spectrometry (LC-MS).
Figure 6
Figure 6
Microtubule protein Tubb6 binds to prion aggregates and targets them to autophagosomes. All the experiments were performed on SMB.s15 cells with or without 10 μM CQ for 16 hrs. (a) Representative immunofluorescence images of Tubb6, lane 1 (N = 3), HSP47, lane 2 (N = 2) and Ubap21, lane 3 (N = 2) with PrPSc showing localisation of individual protein targets with respect to PrPSc in the cytoplasm. (b) Representative WB show increased expression of Tubb6 on CQ treatment (N = 2). (c) Relative expression levels of Tubb6 compared to β-actin on CQ treatment. (d) (1) IP with BC6 (anti-PrP antibody) immunoblotted with Tubb6, red arrow indicates approx. 53 kDa Tubb6 band (2) Beads alone control (3) immunoblotted for BC6 after PK treatment. (e) Reverse IP with Tubb6 (1) immunoblotted with Tubb6 (2) immunoblotted for BC6 after PK treatment. (f) Representative WB to show reduced expression of Tubb6 on siRNA treatment. (g) Representative immunofluorescence images of increased number of PrPSc aggregates after Tubb6 siRNA treatment compared to scramble siRNA, magnified area inside the white square to show PrPSc aggregates are surrounded by Tubb6 in scramble siRNA control (N = 3). (h) Increased numbers of PrPSc aggregates on Tubb6 siRNA treatment (non-significant P = 0.0668). (i) Representative immunofluorescence staining for LC3 and BC6 after 10 μM CQ treatment showing no targeting of PrPSc aggregates to LC3 positive punctae after Tubb6 siRNA treatment compared to the control cells treated with scramble siRNA (N = 3). (j) A significant negative correlation between LC3 and PrPSc aggregates after Tubb6 siRNA treatment compared to the control cells treated with scramble siRNA. Scale bar = 10 μm. Respective full length blots are shown in Supplementary Fig. 3. Abbreviations used Chloroquine (CQ), Proteinase K (PK), Immunoprecipitation (IP).
Figure 7
Figure 7
Spermine enhances colocalisation of Tubb6 with PrPSc aggregates in aggresomes. SMB.s15 cells were treated with10 μM CQ or treated with 5 μM of spermine and 10 μM CQ for 24 hrs. (a) Representative immunofluorescence images of spermine + CQ treated cells showing cells with aggresomes stained with antibodies for Tubb6 and PrPSc aggregates (lower lane) compared to untreated control cells + CQ (upper lane) (N = 3). (b) Representative immunofluorescence image showing colocalisation of HDAC6 and PrPSc aggregates (N = 3). (c) Significantly increased number of cells per microscopic area showing aggresomes on spermine + CQ treatment when compared to untreated control cells+ CQ, each microscopic area contained 5–15 cells, total of 10 microscopic areas were counted. Scale bar = 10 μm. Abbreviations used Chloroquine (CQ).
Figure 8
Figure 8
A pictorial summary of how spermine treatment facilitates degradation of prion aggregates in SMB.s15 cells. Spermine treatment clears prion aggregates by enhancing the autolysosomal flux both by enhancing the number of mature autophagosomes and lysosomes. Treatment with spermine enhances the expression of acetylated tubulins and increases the expression of dynein-HC. Both acetylated tubulins and dynein-HC are known to have a role in stabilising microtubules for retrograde transport of autophagosomes from the cellular periphery to the perinuclear location where the lysosomes reside. Furthermore, spermine treatment facilitates formation of prion aggresomes bound to Tubb6 for their delivery to autophagosomes for their clearance (b). Compared to the untreated control cells (a).

Similar articles

Cited by

References

    1. Levine B, Kroemer G. Autophagy in the pathogenesis of disease. Cell. 2008;132:27–42. doi: 10.1016/j.cell.2007.12.018. - DOI - PMC - PubMed
    1. Komatsu M, et al. Loss of autophagy in the central nervous system causes neurodegeneration in mice. Nature. 2006;441:880–884. doi: 10.1038/nature04723. - DOI - PubMed
    1. Hara T, et al. Suppression of basal autophagy in neural cells causes neurodegenerative disease in mice. Nature. 2006;441:885–889. doi: 10.1038/nature04724. - DOI - PubMed
    1. Webb JL, Ravikumar B, Atkins J, Skepper JN, Rubinsztein DC. Alpha-Synuclein is degraded by both autophagy and the proteasome. The Journal of biological chemistry. 2003;278:25009–25013. doi: 10.1074/jbc.M300227200. - DOI - PubMed
    1. Nascimento-Ferreira I, et al. Overexpression of the autophagic beclin-1 protein clears mutant ataxin-3 and alleviates Machado-Joseph disease. Brain: a journal of neurology. 2011;134:1400–1415. doi: 10.1093/brain/awr047. - DOI - PubMed

Publication types

LinkOut - more resources