. 2018 Jul 3;8(1):10070.
doi: 10.1038/s41598-018-28297-x.

Pirfenidone decreases mesothelioma cell proliferation and migration via inhibition of ERK and AKT and regulates mesothelioma tumor microenvironment in vivo

Affiliations

Pirfenidone decreases mesothelioma cell proliferation and migration via inhibition of ERK and AKT and regulates mesothelioma tumor microenvironment in vivo

Chang Li et al. Sci Rep. .

Abstract

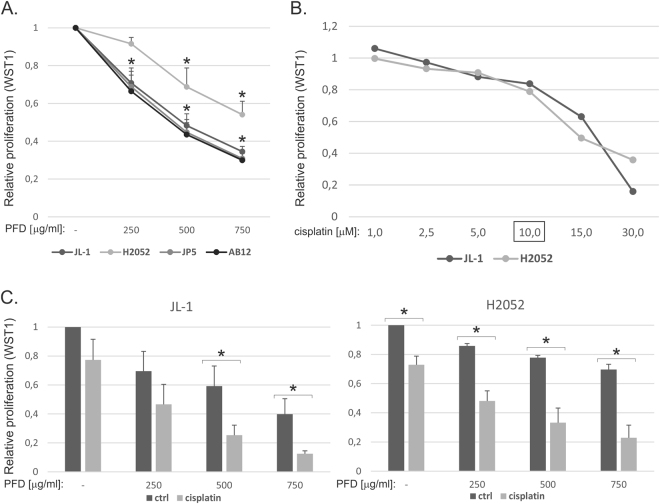
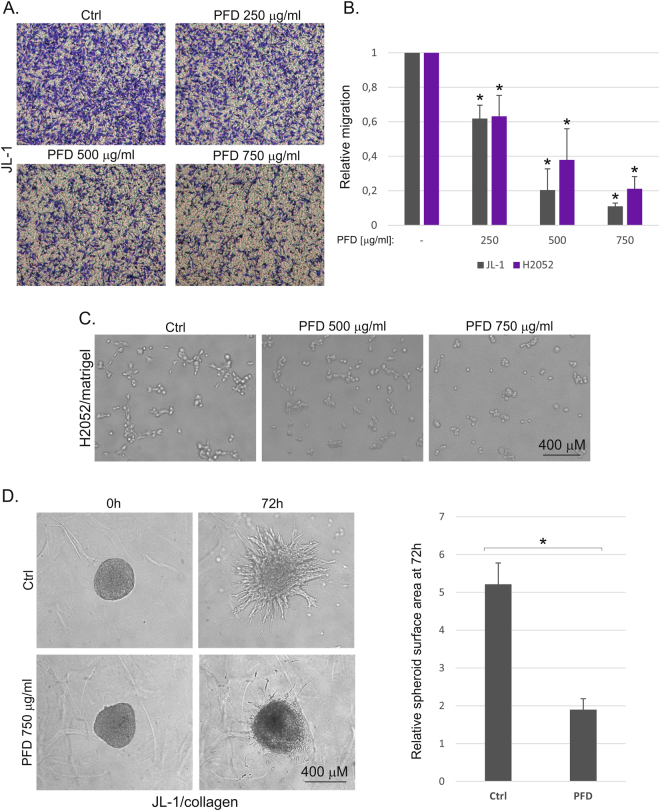
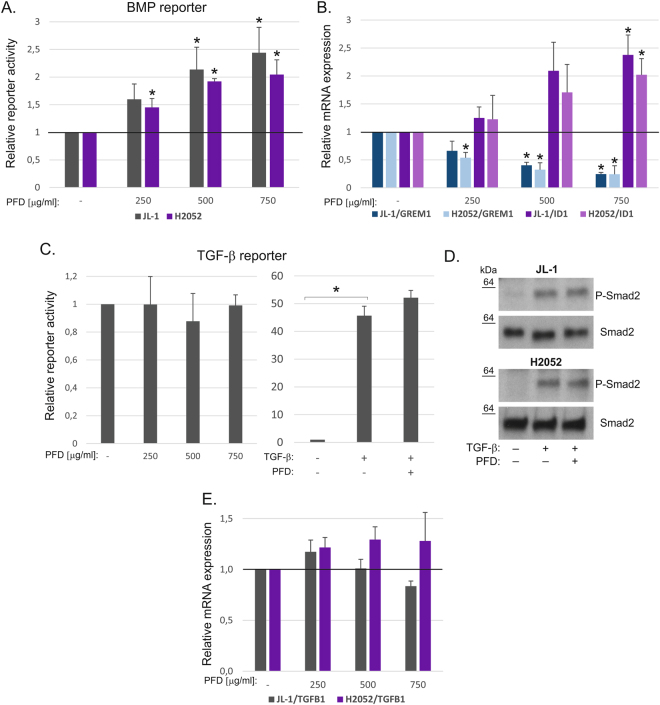
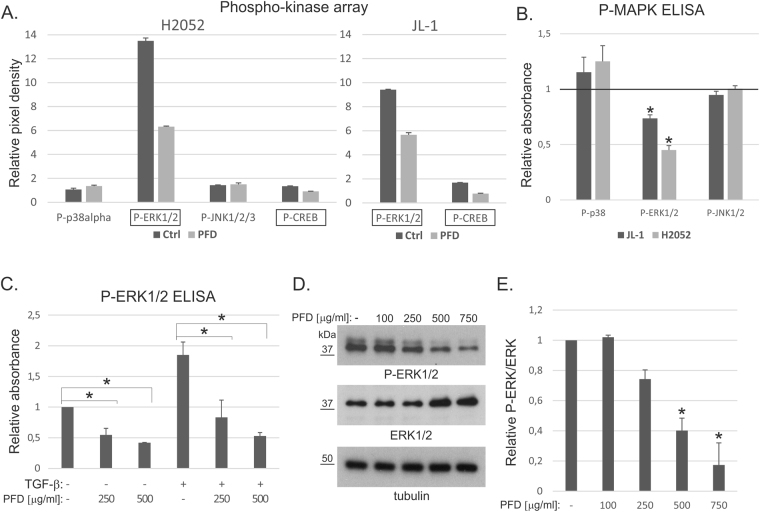
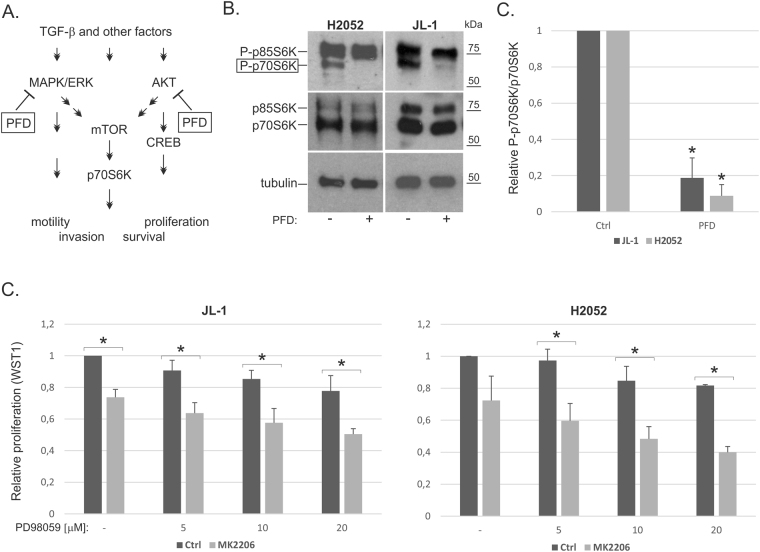
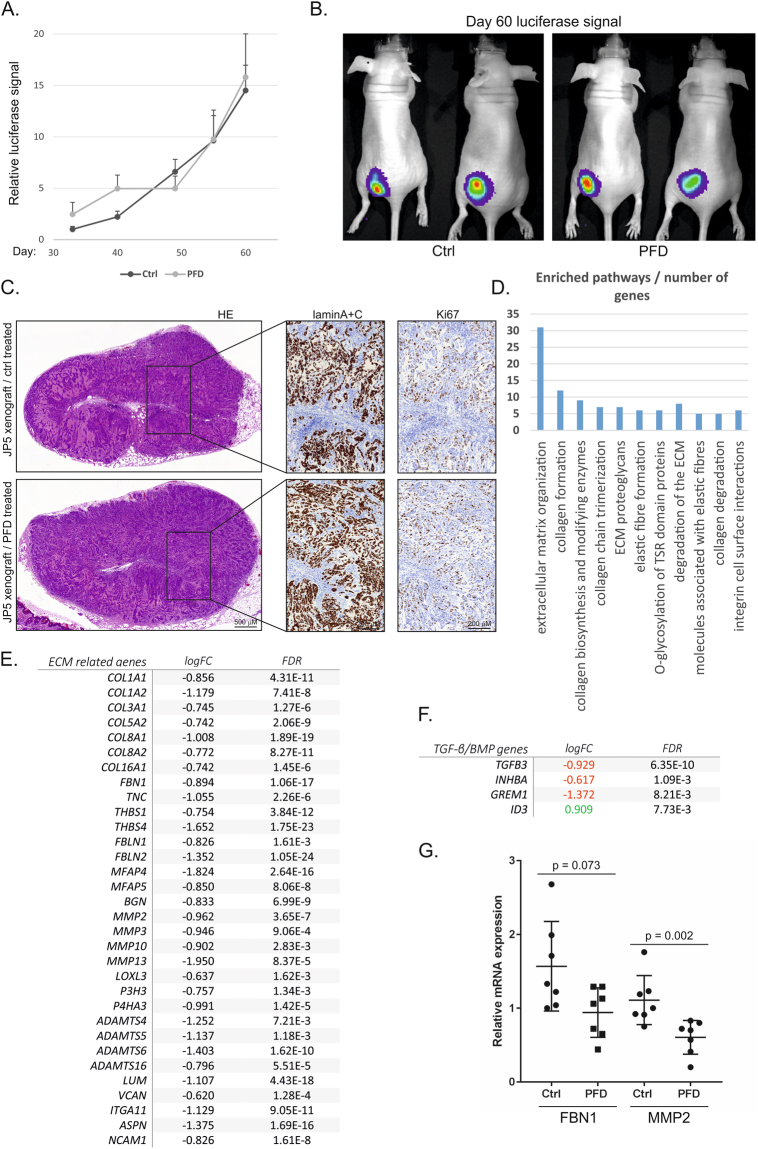
Malignant mesothelioma is an aggressive cancer with poor prognosis. It is characterized by prominent extracellular matrix, mesenchymal tumor cell phenotypes and chemoresistance. In this study, the ability of pirfenidone to alter mesothelioma cell proliferation and migration as well as mesothelioma tumor microenvironment was evaluated. Pirfenidone is an anti-fibrotic drug used in the treatment of idiopathic pulmonary fibrosis and has also anti-proliferative activities. Mesothelioma cell proliferation was decreased by pirfenidone alone or in combination with cisplatin. Pirfenidone also decreased significantly Transwell migration/invasion and 3D collagen invasion. This was associated with increased BMP pathway activity, decreased GREM1 expression and downregulation of MAPK/ERK and AKT/mTOR signaling. The canonical Smad-mediated TGF-β signaling was not affected by pirfenidone. However, pirfenidone blocked TGF-β induced upregulation of ERK and AKT pathways. Treatment of mice harboring mesothelioma xenografts with pirfenidone alone did not reduce tumor proliferation in vivo. However, pirfenidone modified the tumor microenvironment by reducing the expression of extracellular matrix associated genes. In addition, GREM1 expression was downregulated by pirfenidone in vivo. By reducing two major upregulated pathways in mesothelioma and by targeting tumor cells and the microenvironment pirfenidone may present a novel anti-fibrotic and anti-cancer adjuvant therapy for mesothelioma.


Conflict of interest statement

The authors declare no competing interests.

Figures

Figure 1
Figure 1
Pirfenidone inhibits mesothelioma cell proliferation. WST-1 assay was used to analyze cell proliferation. (A) Human (JL-1, H2052 and JP5) and mouse (AB12) mesothelioma cells were treated with increasing concentrations of pirfenidone (PFD, 0–750 μg/ml) for 2 days. The results are expressed relative to the proliferation in control treated cells, which was set to 1. The error bars represent SD (n = 3). *p < 0.05. (B) JL-1 and H2052 cells were treated with increasing concentrations of cisplatin (0–30 μM) for 2 days. The results are expressed relative to the proliferation in control treated cells, which was set to 1. A representative experiment is shown. For combined treatment studies with pirfenidone a concentration of 10 μM cisplatin was chosen. (C) JL-1 and H2052 cells were treated with cisplatin and/or pirfenidone (PFD, 0–750 μg/ml) for 2 days. The results are expressed relative to the proliferation in control treated cells, which was set to 1. The error bars represent SD (n = 3). *p < 0.05.
Figure 2
Figure 2
Pirfenidone reduces mesothelioma cell migration and 3D invasive growth. (A) Invasive migration was analyzed using collagen 1 coated Transwell inserts. Control or pirfenidone (PFD) treated migrated cells were fixed, stained and imaged 16 hours after seeding. Representative images of crystal violet stained JL-1 cells are shown. (B) Invasive migration of JL-1 and H2052 cells 16 hours after seeding is shown. Graphs represent quantification of relative migration. The error bars represent SD (n = 3). *p < 0.05. (C) H2052 cells were embedded into 3D Matrigel matrix. Images of control and pirfenidone (PFD) treated cells from a representative experiment are shown. (D) Invasive growth of control or pirfenidone (PFD) treated JL-1 cells was analyzed in 3D collagen 1 matrix. Cells were followed up to 72 hours. Representative images are shown. Graph shows quantification as relative spheroid surface area. The error bars represent SD (n = 3). *p < 0.05.
Figure 3
Figure 3
Increased BMP pathway activity in pirfenidone treated cells. (A) BMP [(Bre)2-luc] pathway activity was analyzed using a promoter reporter assay. Promoter activities in pirfenidone (PFD) treated cells are shown relative to the level in each control (JL-1 or H2052), which was set to 1. The error bars represent SD (n = 3). *p < 0.05. (B) Expression of ID1 and GREM1 genes in pirfenidone (PFD) treated JL-1 and H2052 cells. The results are expressed relative to each control, which was set to 1. The error bars represent SD (n = 3). *p < 0.05. (C) TGF-β [(CAGA)12-luc] pathway activity was analyzed in H2052 cells using a promoter reporter assay. Promoter activities in pirfenidone (PFD, 750 μg/ml) and/or TGF-β1 (0.5 ng/ml) treated cells are shown relative to the level in control, which was set to 1. (D) Pirfenidone (PFD, 750 μg/ml) and TGF-β1 (0.5 ng/ml) treated JL-1 and H2052 cell lysates were analyzed by Western blotting using antibodies specific to P-Smad2 and Smad2. The molecular weight markers (kDa) are shown on the left. The western blots were derived under the same experimental conditions from the same cell lysate of each treatment group (JL-1 and H2052). (E) Expression of TGFB1 gene in pirfenidone (PFD) treated JL-1 and H2052 cells. The results are expressed relative to each control, which was set to 1. The error bars represent SD (n = 3).
Figure 4
Figure 4
Pirfenidone reduces ERK activation. (A) JL-1 and H2052 cell lysates from control and pirfenidone (PFD, 500 µg/ml, 4 hours) treated cells were analyzed using a commercial phospho-protein array. Quantification of alterations in the amounts of phospho-proteins (n = 2) is shown. (B) JL-1 and H2052 cell lysates from pirfenidone (PFD, 500 µg/ml, 4 hours) treated cells were analyzed by P-MAPK ELISA. The results are expressed relative to each control, which was set to 1. The error bars represent SD (n = 3). *p < 0.05. (C) H2052 cell lysates from pirfenidone (PFD, 500 µg/ml) and/or TGF-β1 (0.5 ng/ml) treated (4 hours) cells were analyzed by P-ERK1/2 ELISA. The results are expressed relative to control, which was set to 1. The error bars represent SD (n = 3). *p < 0.05. (D) Pirfenidone (PFD) treated H2052 cell lysates were analyzed by Western blotting using antibodies specific to P-ERK1/2, ERK1/2 or tubulin. The molecular weight markers (kDa) are shown on the left. The western blots were derived under the same experimental conditions from the same cell lysate. (E) Quantification of band intensities. P-ERK/ERK levels were calculated and normalized using the tubulin loading control. The results are expressed relative to control, which was set to 1. The error bars represent SD (n = 3). *p < 0.05.
Figure 5
Figure 5
CREB and AKT pathway regulation by pirfenidone. (A) JL-1 cell lysates from pirfenidone (PFD, 4 hours) or forskolin (FSK, 10 µM, positive control) treated cells were analyzed by CREB ELISA. P-CREB/CREB results are expressed relative to control, which was set to 1. The error bars represent SD (n = 3). *p < 0.05. (B) Cell lysates from pirfenidone (PFD, 750 µg/ml) and/or TGF-β1 (0.5 ng/ml) treated (4 hours) cells were analyzed by Western blotting using antibodies specific to P-AKT, AKT or tubulin. The molecular weight markers (kDa) are shown on the right. (C,D) Cell lysates from pirfenidone (PFD, 0–750 µg/ml) treated (1–4 hours) cells were analyzed by Western blotting using antibodies specific to P-CREB, AKT or tubulin. (E) Cell lysates from pirfenidone (PFD, 750 µg/ml), MG132 (10 µM) and/or TGF-β1 (0.5 ng/ml) treated (4 hours) cells were analyzed by Western blotting using antibodies specific to P-CREB, AKT or tubulin. (F) Quantification of AKT band intensities, which were normalized using the tubulin loading control. The results are expressed relative to each control (JL-1 or H2052), which was set to 1. The error bars represent SD (n = 3). *p < 0.05 when compared to the sample without any treatment. #p < 0.05. At least three independent experiments were performed for all quantifications. The western blots were derived under the same experimental conditions from the same cell lysate of each treatment group (BE). The original full-length western blot images (D) and additional exposures (B) are shown in Supplementary figure 5.
Figure 6
Figure 6
p70S6K phosphorylation is decreased by pirfenidone (A). A schematic presentation of pirfenidone activity. (B) Cell lysates from pirfenidone (PFD, 750 µg/ml) treated (4 hours) cells were analyzed by Western blotting using antibodies specific to P-p70S6K/P-p85S6K, p70S6K/p85S6K or tubulin. (F) Quantification of P-p70S6K and p70S6K band intensities. P-p70S6K/p70S6K levels were calculated and the results are expressed relative to each control (JL-1 or H2052), which was set to 1. The error bars represent SD (n = 3–4). *p < 0.05. At least three independent experiments were performed for all quantifications. The western blots were derived under the same experimental conditions from the same cell lysate of each treatment group (JL-1 and H2052).
Figure 7
Figure 7
Pirfenidone induces downregulation of the expression of ECM associated genes in vivo (A). JP5 mesothelioma cells transduced to express a luciferase marker were injected subcutaneously as Matrigel plugs. Tumor growth was followed by luciferase signal measurements for 60 days. The error bars represent SEM (n = 8). (B) Images of luciferase signal detection of control and pirfenidone (PFD, 200 mg/kg/day) treated mice at day 60. (C) Subcutaneous tumors from control and pirfenidone (PFD) treated mice were stained with hematoxylin & eosin (HE), antibodies specific to human lamin A + C or the proliferation marker Ki67. Representative images are shown. (D) RNA sequencing was performed from Ctrl (n = 3) and pirfenidone (n = 4) treated tumors. Gene set enrichment analysis was performed using Reactome. Top hit pathways are shown. (E) A list of genes included in the “extracellular matrix organization” Reactome-pathway. Logarithmic fold change (logFC) and false discovery rate (FDR) for each gene are shown. (F) Differentially expressed TGF-β/BMP pathway genes. (G) Expression of FBN1 and MMP2 genes in the tumor tissue of control (Ctrl) and pirfenidone (PFD) treated mice (n = 7). Quantitative RT-PCR results are expressed relative to control tumor-1, which was set to 1.

References

    1. Mossman BT, et al. New insights into understanding the mechanisms, pathogenesis, and management of malignant mesotheliomas. Am J Pathol. 2013;182:1065–1077. doi: 10.1016/j.ajpath.2012.12.028. - DOI - PMC - PubMed
    1. Roe OD, Stella GM. Malignant pleural mesothelioma: history, controversy and future of a manmade epidemic. Eur Respir Rev. 2015;24:115–131. doi: 10.1183/09059180.00007014. - DOI - PMC - PubMed
    1. Klebe S, et al. Sarcomatoid mesothelioma: a clinical-pathologic correlation of 326 cases. Mod Pathol. 2010;23:470–479. doi: 10.1038/modpathol.2009.180. - DOI - PubMed
    1. Husain AN, et al. Guidelines for pathologic diagnosis of malignant mesothelioma: 2012 update of the consensus statement from the International Mesothelioma Interest Group. Arch Pathol Lab Med. 2013;137:647–667. doi: 10.5858/arpa.2012-0214-OA. - DOI - PubMed
    1. Yap TA, Aerts JG, Popat S, Fennell DA. Novel insights into mesothelioma biology and implications for therapy. Nat Rev Cancer. 2017;17:475–488. doi: 10.1038/nrc.2017.42. - DOI - PubMed

Publication types

MeSH terms