. 2018 Jul 3;8(1):10024.
doi: 10.1038/s41598-018-28237-9.

Quasi-Periodic Patterns of Neural Activity improve Classification of Alzheimer's Disease in Mice

Affiliations

Quasi-Periodic Patterns of Neural Activity improve Classification of Alzheimer's Disease in Mice

Michaël E Belloy et al. Sci Rep. .

Erratum in

Abstract

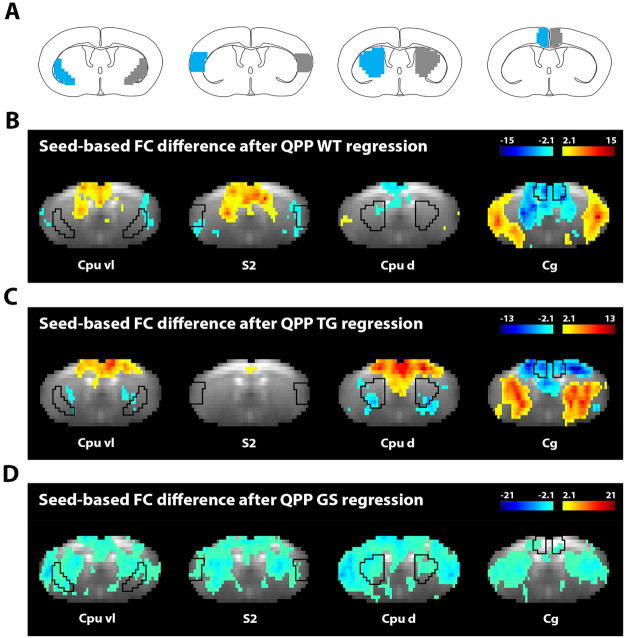
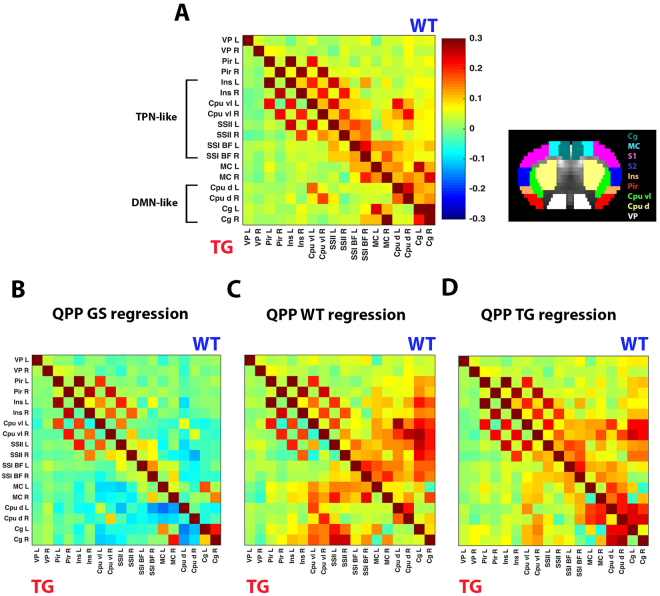
Resting state (rs)fMRI allows measurement of brain functional connectivity and has identified default mode (DMN) and task positive (TPN) network disruptions as promising biomarkers for Alzheimer's disease (AD). Quasi-periodic patterns (QPPs) of neural activity describe recurring spatiotemporal patterns that display DMN with TPN anti-correlation. We reasoned that QPPs could provide new insights into AD network dysfunction and improve disease diagnosis. We therefore used rsfMRI to investigate QPPs in old TG2576 mice, a model of amyloidosis, and age-matched controls. Multiple QPPs were determined and compared across groups. Using linear regression, we removed their contribution from the functional scans and assessed how they reflected functional connectivity. Lastly, we used elastic net regression to determine if QPPs improved disease classification. We present three prominent findings: (1) Compared to controls, TG2576 mice were marked by opposing neural dynamics in which DMN areas were anti-correlated and displayed diminished anti-correlation with the TPN. (2) QPPs reflected lowered DMN functional connectivity in TG2576 mice and revealed significantly decreased DMN-TPN anti-correlations. (3) QPP-derived measures significantly improved classification compared to conventional functional connectivity measures. Altogether, our findings provide insight into the neural dynamics of aberrant network connectivity in AD and indicate that QPPs might serve as a translational diagnostic tool.


Conflict of interest statement

The authors declare no competing interests.

Figures

Figure 1
Figure 1
Group comparisons of Quasi-Periodic patterns via ‘projection’. QPPs were independently derived from the WT (left, blue) and TG (right, red) group, using a spatiotemporal pattern finding algorithm. In each group, the algorithm was used to obtain a set of n QPPs at each investigated window length (illustrative QPPs are displayed on the three lower rows). Each of these QPPs is accompanied by a Sliding Template Correlation (STC) series, i.e. the sliding correlation of the QPP with the functional image series from which it was derived (color-coded traces next to respective QPPs). Peak correlations above an arbitrary threshold indicate QPP occurrences. This is illustrated for top row QPPs (arrows), indicating corresponding images in the functional scans. QPPs derived from one group’s image series (reference), can be compared with the other group’s image series (target) via projection (p)STC (e.g. blue arrow from WT QPP1 onto TG image series). Occurrences of one group’s QPPs can thus be determined in the opposing group. Additionally, pSTCs from a reference QPP can be compared with STCs from QPPs in the target group (blue and red traces in right panels). The goal of this comparison is to determine the closest matching QPP, which correlates to the image series in the same way. pSTCs and STCs with the strongest similarity, determined via cross-correlation, identify corresponding QPPs across groups (*). Schematic brain images indicate the brain slice investigated in the current study. Abbreviations. QPP, Quasi-Periodic Pattern; pSTC, projection sliding-template correlation.
Figure 2
Figure 2
Three Quasi-Periodic patterns indicate the largest group differences in spatiotemporal brain dynamics. (AC) The QPPs that most strongly correlated with the image series in WT and TG, at 3 and 6 s window sizes, are shown. Because 3 s QPPs displayed highly different patterns across groups, pSTC was used to determine the closest matching QPP in the opposing group. QPPs are displayed as thresholded T-maps, overlain on the respective brain image across time (one-sample T-test, FDR p < 0.001). (D) Location of the investigated brain slice and anatomical regions that correspond to hypothesized regions of the mouse DMN- and TPN-like networks. (A) The 3 s QPP derived from the WT group (QPP WT). Note in red, co-activity of Cg and Cpu d areas (DMN). In blue, de-activated areas are S1, S2, Ins and Cpu vl (TPN). The matching QPP in TG displayed a similar pattern, with less ‘intact’ DMN- and TPN-like networks. (B) The 3 s QPP derived from the TG group (QPP TG). Note, as opposed to QPP WT, that QPP TG displayed anti-correlation between Cg and Cpu d regions. The matching QPP in WT displayed a similar pattern, which included co-activation of some TPN-like components. (C) The 6 s global signal-like QPP derived from the WT (top) and TG (bottom) groups. Both displayed a similar spatiotemporal shape (spatial correlation = 0.75). This QPP is commonly referred to as QPP GS. Note the involvement of many brain regions. In TG, lateral cortical areas (TPN-like) appeared less clearly co-active. (E) Subject mean occurrence rates for all QPPs, based on STC and pSTC (two-sample T-test, **p < 0.01, ***p < 0.001, error flags show standard error). (F) Illustration of temporal overlap between the three described QPPs in their respective groups. The STC of QPP TG was inverted to account for its opposite phase. Abbreviations. FDR, False-Discovery Rate; GS; global signal; STC, sliding-template correlation series; cc, cross-correlation; Cg, Cingulate area; Cpu d, Caudate Putamen dorsal; S1, somatosensory area 1; S2, somatosensory area 2, Cpu vl, Caudate Putamen ventro-lateral; Ins, Insular cortex; Pir, piriform cortex; DMN, Default Mode network; TPN, Task-Positive network.
Figure 3
Figure 3
Regression of Quasi-Periodic patterns reveals how they reflect functional connectivity. QPPs are hypothesized to reflect a time-varying process that contributes to BOLD FC. To confirm this hypothesis, we investigated the change in seed-based FC after linear regression of each QPP out of the image series. (A) Left seed regions, and their contralateral counterpart, are indicated in respectively blue and grey on representative schematic brain images. (BD) FC difference maps for left seed regions, specified at the bottom of the panel, after regression of QPP WT in WT group (B) QPP TG in TG group (C) and QPP GS in WT group (D). Seed locations and contralateral counterparts are indicated by black contours. Maps show T-values, based on voxel-wise zFC distributions of all animals in the respective group, and are liberally thresholded to show the full extent of FC change (two-sample T-test, p < 0.05). Positive and negative T-values display voxels that, after QPP regression, respectively demonstrated increased or decreased FC with respect to the seed. Note for all three QPPs the loss of FC between brain regions that were co-active within the QPP, and the increase in FC between areas that were anti-correlated. Abbreviations. Cg, Cingulate area; Cpu d, Caudate Putamen dorsal; S2, somatosensory area 2, Cpu vl, Caudate Putamen ventro-lateral.
Figure 4
Figure 4
Regression of Quasi-Periodic patterns reveals how they reflect functional connectivity differences between wild type and transgenic mice. (A) ROI-based zFC matrix showing in the top triangle subject-average values for the WT group and in the lower triangle values for the TG group. ROI-locations are indicated on the right. Note lower DMN-like FC in TG compared to WT. (BD) Same as in (A) but now after first regressing in both groups: (B) QPP GS, (C) QPP WT, and (D) QPP TG. ROI FC matrices indicate that QPP regression affected DMN-like (Cpu d and Cg) FC differences by either (B) further emphasizing the difference and diminishing FC, (C) removing the difference and diminishing FC, or (D) removing the difference and increasing FC. Another major effect of QPP regression was the increased correlation between DMN-TPN-like brain areas, hinting new group differences.
Figure 5
Figure 5
Quasi-Periodic patterns reflect default mode network functional connectivity group differences, and reveal decreased default mode with task positive network dynamic anti-correlation in transgenic mice. Subject average zFC values between (A) all DMN-like area pairs and (B) all DMN-TPN-like area pairs. Bar graphs display group average FC under conditions of no QPP regression (left) and after regression of indicated QPPs (two-sample T-test, *p < 0.05, ***p < 0.001, ****p < 0.0001, error flags indicate standard error). (A) Note how QPP GS regression increased the significance of the DMN-like FC group difference. Regression of QPP WT, which showed clear involvement of DMN-like areas, lowered overall DMN-like FC and removed significant WT-TG differences. Regression of QPP TG, which showed anti-correlation between DMN-like areas, increased overall DMN-like FC and removed WT-TG differences. Thus, QPPs in WT and TG displayed opposing brain dynamics, which appeared to reflect DMN-like FC differences between groups. (B) Regression of QPP TG, and especially QPP WT, which showed anti-correlation between DMN-TPN-like regions, revealed DMN-TPN-like FC increases that were significantly higher for WT compared to TG animals. Thus, QPPs appeared to be responsible for anti-correlated DMN-TPN-like dynamics, which could not be identified with conventional rsfMRI analysis.
Figure 6
Figure 6
Classification is improved through Quasi-Periodic Patterns. (A) AUC-values of ROC-curves constructed for classifications based on each individual resting state measure and for the combined model, which evaluated all measures simultaneously (right, grey). AUC-values are shown as mean and standard error of the mean. Note 100% classification for some QPP-derived measures. (B) All 100 absolute beta values for each individual measure in the combined model, obtained through repeated model cross-validation. High beta-values imply the importance of the respective measure. DMN- and DMN-TPN-like ΔFC after QPP TG regression, together with DMN-TPN-like ΔFC after QPP WT regression, showed the highest contributions. Overall, findings indicate that subject-wise contribution of QPPs to FC provides the most sensitive measure for classification. Abbreviations. AUC, Area Under the Curve; ROC, Receiver Operating Characteristic; ΔFC, Functional connectivity change.

Similar articles

Cited by

References

    1. Barage SH, Sonawane KD. Amyloid cascade hypothesis: Pathogenesis and therapeutic strategies in Alzheimer’s disease. Neuropeptides. 2015;52:1–18. - PubMed
    1. Hardy JA, Higgins GA. Alzheimer’s disease: the amyloid cascade hypothesis. Science (80-.) 1992;256:184–185. - PubMed
    1. Kumar A, Ekavali AS. A review on Alzheimer’s disease pathophysiology and its management: an update. Pharmacol. Reports. 2015;67:195–203. - PubMed
    1. Palop JJ, Mucke L. Amyloid-β Induced Neuronal Dysfunction in Alzheimer’s Disease: From Synapses toward Neural Networks. Nat Neurosci. 2010;13:812–818. - PMC - PubMed
    1. Biswal B, Yetkin F, Haughton V, Hyde J. Functional connectivity in the motor cortex of resting human brain using. Magn Reson Med. 1995;34:537–541. - PubMed

Publication types