

The influence of meteorological factors on tuberculosis incidence in Southwest China from 2006 to 2015
- PMID: 29968800
- PMCID: PMC6030127
- DOI: 10.1038/s41598-018-28426-6
The influence of meteorological factors on tuberculosis incidence in Southwest China from 2006 to 2015
Abstract
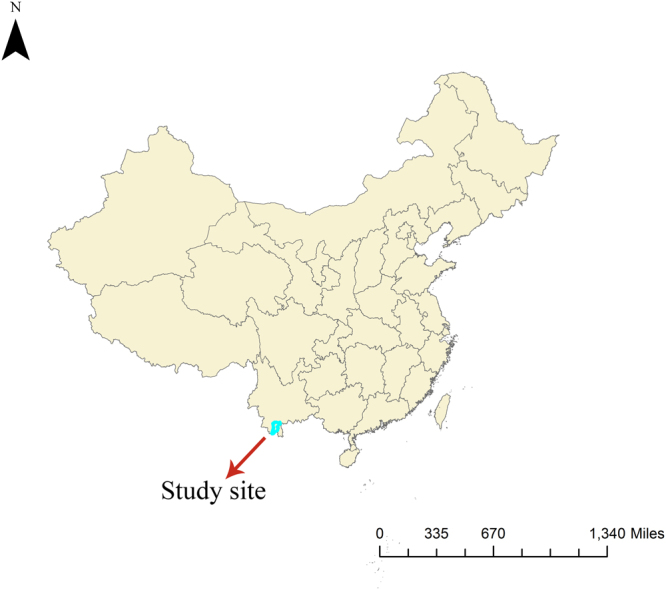
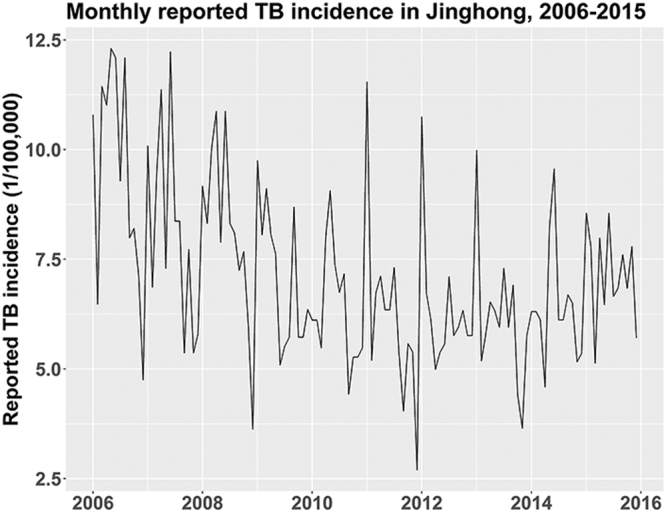
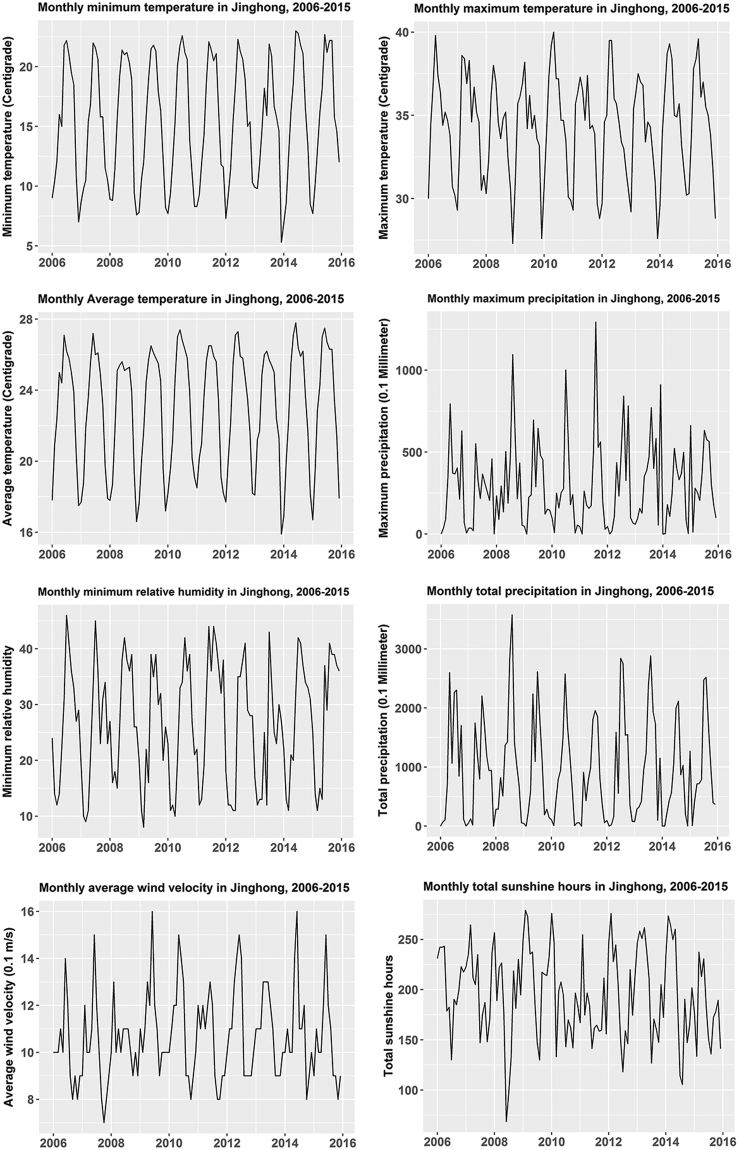
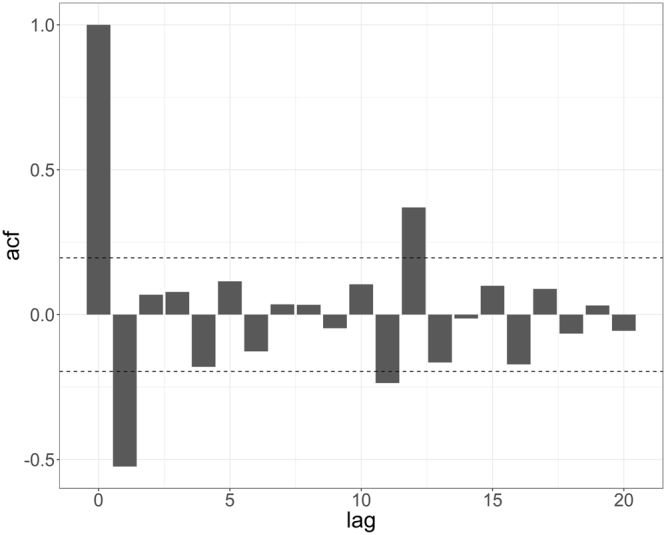
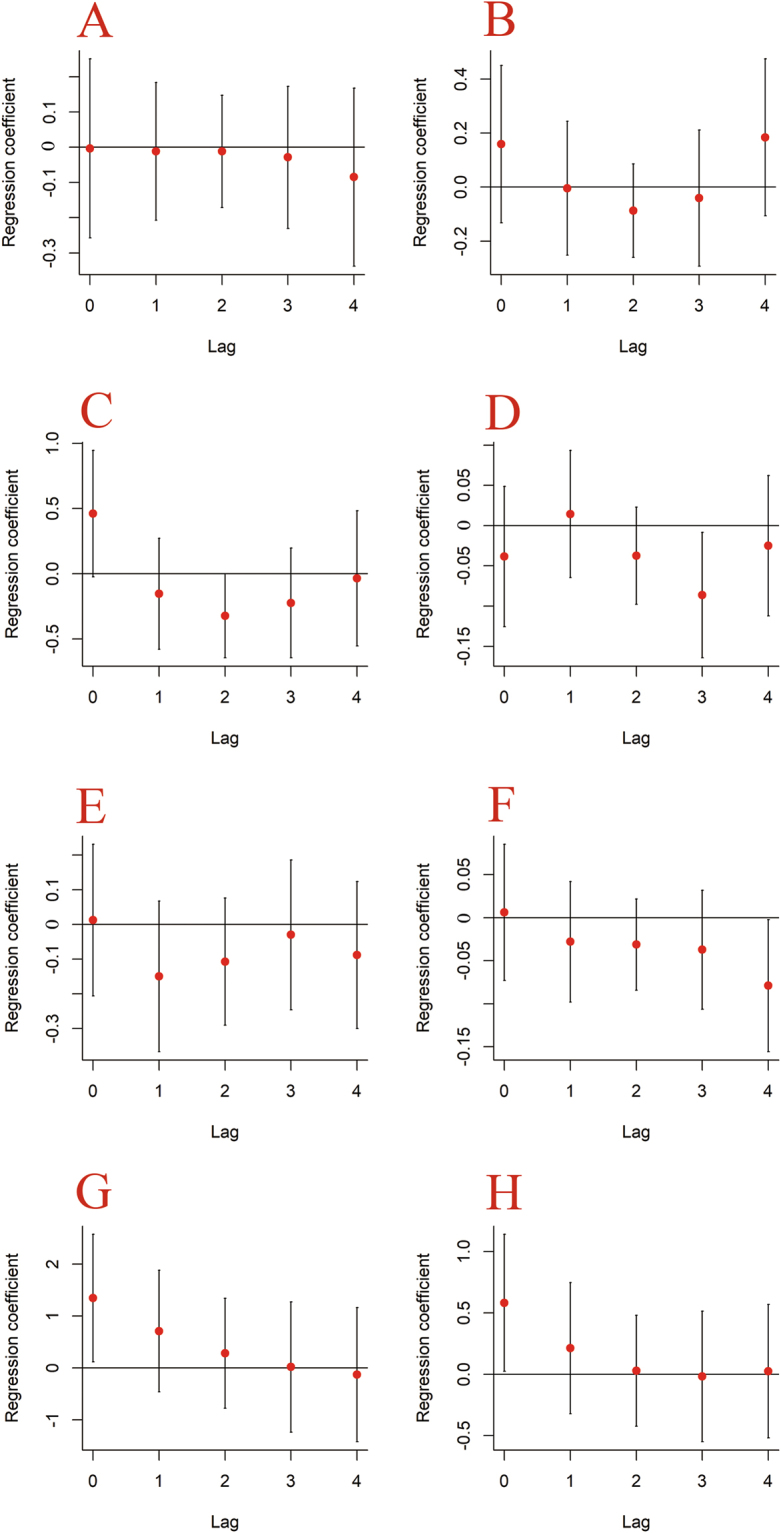
The influence of meteorological determinants on tuberculosis (TB) incidence remains severely under-discussed, especially through the perspective of time series analysis. In the current study, we used a distributed lag nonlinear model (DLNM) to analyze a 10-year series of consecutive surveillance data. We found that, after effectively controlling for autocorrelation, the changes in meteorological factors related to temperature, humidity, wind and sunshine were significantly associated with subsequent fluctuations in TB incidence: average temperature was inversely associated with TB incidence at a lag period of 2 months; total precipitation and minimum relative humidity were also inversely associated with TB incidence at lag periods of 3 and 4 months, respectively; average wind velocity and total sunshine hours exhibited an instant rather than lagged influence on TB incidence. Our study results suggest that preceding meteorological factors may have a noticeable effect on future TB incidence; informed prevention and preparedness measures for TB can therefore be constructed on the basis of meteorological variations.
Conflict of interest statement
The authors declare no competing interests.
Figures
Similar articles
-
Effect of meteorological factors on scarlet fever incidence in Guangzhou City, Southern China, 2006-2017.Sci Total Environ. 2019 May 1;663:227-235. doi: 10.1016/j.scitotenv.2019.01.318. Epub 2019 Jan 25. Sci Total Environ. 2019. PMID: 30711589
-
Meteorological factors contribute to the risk of pulmonary tuberculosis: A multicenter study in eastern China.Sci Total Environ. 2021 Nov 1;793:148621. doi: 10.1016/j.scitotenv.2021.148621. Epub 2021 Jun 24. Sci Total Environ. 2021. PMID: 34328976
-
[Analysis on association between incidence of hand foot and mouth disease and meteorological factors in Xiamen, 2013-2017].Zhonghua Liu Xing Bing Xue Za Zhi. 2019 May 10;40(5):531-536. doi: 10.3760/cma.j.issn.0254-6450.2019.05.008. Zhonghua Liu Xing Bing Xue Za Zhi. 2019. PMID: 31177733 Chinese.
-
Association between averaged meteorological factors and tuberculosis risk: A systematic review and meta-analysis.Environ Res. 2022 Sep;212(Pt D):113279. doi: 10.1016/j.envres.2022.113279. Epub 2022 May 11. Environ Res. 2022. PMID: 35561834
-
Relationship between meteorological factors and the incidence of severe fever with thrombocytopenia syndrome: a systematic review and meta-analysis.BMC Public Health. 2025 Jan 27;25(1):340. doi: 10.1186/s12889-025-21527-8. BMC Public Health. 2025. PMID: 39871274 Free PMC article.
Cited by
-
Spatial spillover effect of environmental factors on the tuberculosis occurrence among the elderly: a surveillance analysis for nearly a dozen years in eastern China.BMC Public Health. 2024 Jan 17;24(1):209. doi: 10.1186/s12889-024-17644-5. BMC Public Health. 2024. PMID: 38233763 Free PMC article.
-
The characteristics of spatial-temporal distribution and cluster of tuberculosis in Yunnan Province, China, 2005-2018.BMC Public Health. 2019 Dec 21;19(1):1715. doi: 10.1186/s12889-019-7993-5. BMC Public Health. 2019. PMID: 31864329 Free PMC article.
-
An investigation of the effects of meteorological factors on the incidence of tuberculosis.Sci Rep. 2024 Jan 24;14(1):2088. doi: 10.1038/s41598-024-52278-y. Sci Rep. 2024. PMID: 38267494 Free PMC article.
-
Spatiotemporal Distribution of Tuberculosis in the Oromia Region of Ethiopia: A Hotspot Analysis.Trop Med Infect Dis. 2023 Sep 7;8(9):437. doi: 10.3390/tropicalmed8090437. Trop Med Infect Dis. 2023. PMID: 37755898 Free PMC article.
-
The long-term effects of meteorological parameters on pertussis infections in Chongqing, China, 2004-2018.Sci Rep. 2020 Oct 14;10(1):17235. doi: 10.1038/s41598-020-74363-8. Sci Rep. 2020. PMID: 33057239 Free PMC article.
References
-
- World Health Organization. Tuberculosis Fact sheet, http://www.who.int/mediacentre/factsheets/fs104/en/ (last accessed 7 Aug, 2017) (2017).
-
- Mandell, G., Bennett, J. & Dolin, R. Mandell, Douglas, and Bennett’s principles and practice of infectious diseases (7th ed.) (Philadelphia, 2009).
-
- World Health Organization. Global tuberculosis report 2016, http://www.who.int/tb/publications/global_report/en/ (last accessed 7 Aug, 2017) (2017).
Publication types
MeSH terms
Grants and funding
LinkOut - more resources
Full Text Sources
Other Literature Sources
Medical
