

Severe Obstructive Sleep Apnea Is Associated with Alterations in the Nasal Microbiome and an Increase in Inflammation
- PMID: 29969291
- PMCID: PMC6353011
- DOI: 10.1164/rccm.201801-0119OC
Severe Obstructive Sleep Apnea Is Associated with Alterations in the Nasal Microbiome and an Increase in Inflammation
Abstract
Rationale: Obstructive sleep apnea (OSA) is associated with recurrent obstruction, subepithelial edema, and airway inflammation. The resultant inflammation may influence or be influenced by the nasal microbiome.
Objectives: To evaluate whether the composition of the nasal microbiota is associated with obstructive sleep apnea and inflammatory biomarkers.
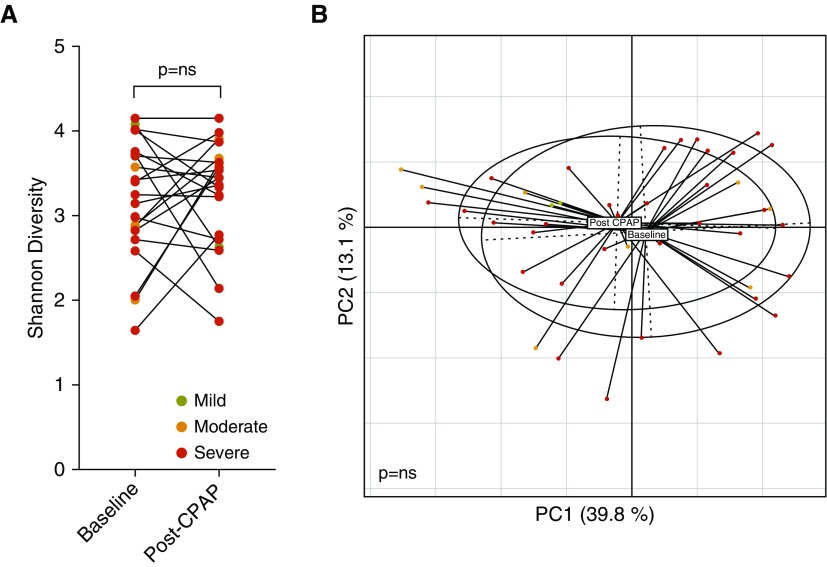
Methods: Two large cohorts were used: 1) a discovery cohort of 472 subjects from the WTCSNORE (Seated, Supine and Post-Decongestion Nasal Resistance in World Trade Center Rescue and Recovery Workers) cohort, and 2) a validation cohort of 93 subjects rom the Zaragoza Sleep cohort. Sleep apnea was diagnosed using home sleep tests. Nasal lavages were obtained from cohort subjects to measure: 1) microbiome composition (based on 16S rRNA gene sequencing), and 2) biomarkers for inflammation (inflammatory cells, IL-8, and IL-6). Longitudinal 3-month samples were obtained in the validation cohort, including after continuous positive airway pressure treatment when indicated.
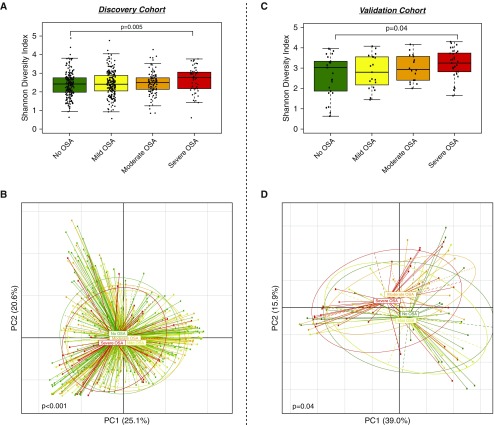
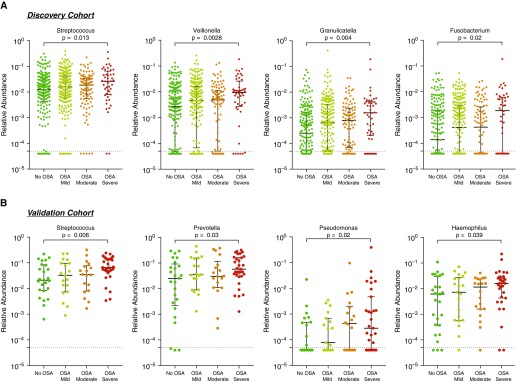
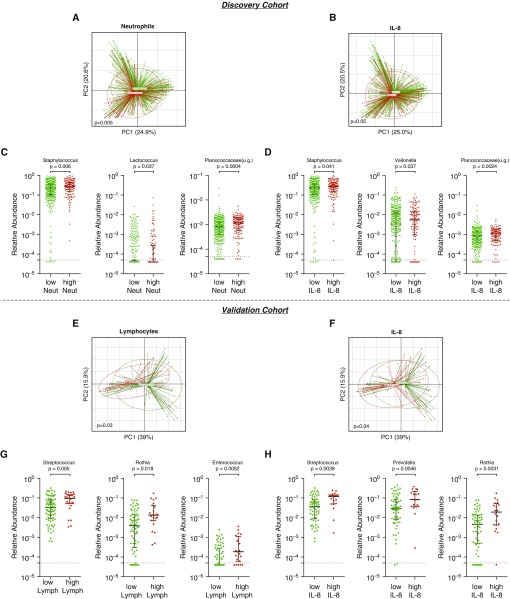
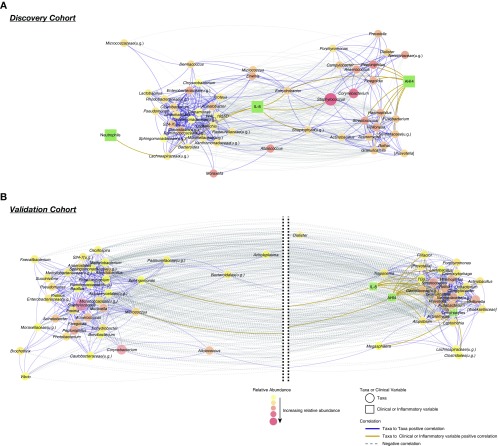
Measurements and main results: In both cohorts, we identified that: 1) severity of OSA correlated with differences in microbiome diversity and composition; 2) the nasal microbiome of subjects with severe OSA were enriched with Streptococcus, Prevotella, and Veillonella; and 3) the nasal microbiome differences were associated with inflammatory biomarkers. Network analysis identified clusters of cooccurring microbes that defined communities. Several common oral commensals (e.g., Streptococcus, Rothia, Veillonella, and Fusobacterium) correlated with apnea-hypopnea index. Three months of treatment with continuous positive airway pressure did not change the composition of the nasal microbiota.
Conclusions: We demonstrate that the presence of an altered microbiome in severe OSA is associated with inflammatory markers. Further experimental approaches to explore causal links are needed.
Keywords: biomarkers; chronic rhinosinusitis; inflammation; microbiome.
Figures
Similar articles
-
Association of obstructive sleep apnea severity with the composition of the upper airway microbiome.J Clin Sleep Med. 2022 Feb 1;18(2):505-515. doi: 10.5664/jcsm.9640. J Clin Sleep Med. 2022. PMID: 34463248 Free PMC article.
-
The influence of obstructive sleep apnea and continuous positive airway pressure on the nasal microbiome.Eur Rev Med Pharmacol Sci. 2023 Mar;27(6):2605-2618. doi: 10.26355/eurrev_202303_31797. Eur Rev Med Pharmacol Sci. 2023. PMID: 37013778
-
Measurement of fractional exhaled nitric oxide and nasal nitric oxide in male patients with obstructive sleep apnea.Sleep Breath. 2019 Sep;23(3):785-793. doi: 10.1007/s11325-018-1760-1. Epub 2018 Dec 12. Sleep Breath. 2019. PMID: 30542936 Free PMC article.
-
The Nose and Nasal Breathing in Sleep Apnea.Otolaryngol Clin North Am. 2020 Jun;53(3):385-395. doi: 10.1016/j.otc.2020.02.002. Epub 2020 Mar 17. Otolaryngol Clin North Am. 2020. PMID: 32192710 Review.
-
Metabolomics and microbiome profiling as biomarkers in obstructive sleep apnoea: a comprehensive review.Eur Respir Rev. 2021 May 11;30(160):200220. doi: 10.1183/16000617.0220-2020. Print 2021 Jun 30. Eur Respir Rev. 2021. PMID: 33980666 Free PMC article. Review.
Cited by
-
Pharyngeal Inflammation on Positron Emission Tomography/Magnetic Resonance Imaging Before and After Obstructive Sleep Apnea Treatment.Ann Am Thorac Soc. 2023 Apr;20(4):574-583. doi: 10.1513/AnnalsATS.202207-594OC. Ann Am Thorac Soc. 2023. PMID: 36476449 Free PMC article.
-
Changes in the nasopharyngeal and oropharyngeal microbiota in pediatric obstructive sleep apnea before and after surgery: a prospective study.BMC Microbiol. 2024 Mar 8;24(1):79. doi: 10.1186/s12866-024-03230-7. BMC Microbiol. 2024. PMID: 38459431 Free PMC article.
-
[Analysis of propensity score matching between inflammatory factor levels and gene polymorphisms and susceptibility to obstructive sleep apnea].Lin Chuang Er Bi Yan Hou Tou Jing Wai Ke Za Zhi. 2021 Aug;35(8):728-732. doi: 10.13201/j.issn.2096-7993.2021.08.012. Lin Chuang Er Bi Yan Hou Tou Jing Wai Ke Za Zhi. 2021. PMID: 34304535 Free PMC article. Chinese.
-
Interleukins as a potential link between obstructive sleep apnea and renal cell carcinoma.Contemp Oncol (Pozn). 2025;29(2):131-149. doi: 10.5114/wo.2025.151584. Epub 2025 May 28. Contemp Oncol (Pozn). 2025. PMID: 40620892 Free PMC article. Review.
-
Whole-Genome Metagenomic Analysis of the Oral Microbiota in Patients with Obstructive Sleep Apnea Comorbid with Major Depressive Disorder.Nat Sci Sleep. 2024 Jul 29;16:1091-1108. doi: 10.2147/NSS.S474052. eCollection 2024. Nat Sci Sleep. 2024. PMID: 39100910 Free PMC article.
References
-
- Ryan CF, Lowe AA, Li D, Fleetham JA. Magnetic resonance imaging of the upper airway in obstructive sleep apnea before and after chronic nasal continuous positive airway pressure therapy. Am Rev Respir Dis. 1991;144:939–944. - PubMed
-
- Paulsen FP, Steven P, Tsokos M, Jungmann K, Müller A, Verse T, et al. Upper airway epithelial structural changes in obstructive sleep-disordered breathing. Am J Respir Crit Care Med. 2002;166:501–509. - PubMed
Publication types
MeSH terms
Substances
Grants and funding
LinkOut - more resources
Full Text Sources
Other Literature Sources
