. 2018 Aug;36(7):597-605.
doi: 10.1038/nbt.4162. Epub 2018 Jul 2.

Human embryonic stem cell-derived cardiomyocytes restore function in infarcted hearts of non-human primates

Affiliations

Human embryonic stem cell-derived cardiomyocytes restore function in infarcted hearts of non-human primates

Yen-Wen Liu et al. Nat Biotechnol. 2018 Aug.

Erratum in

Abstract

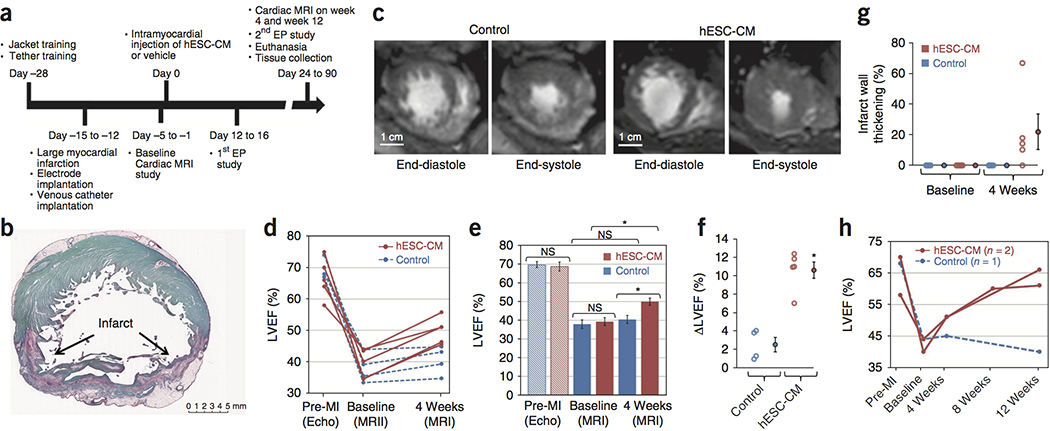
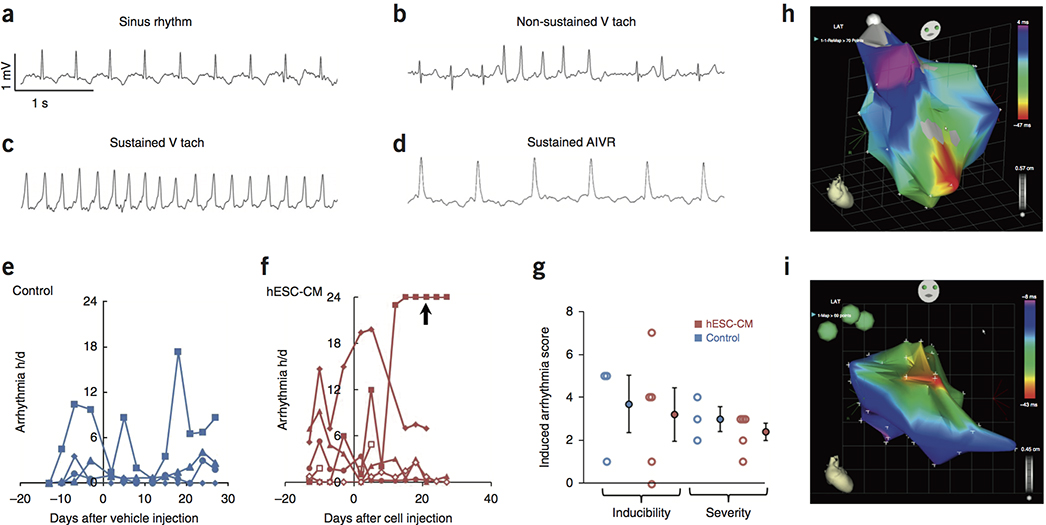
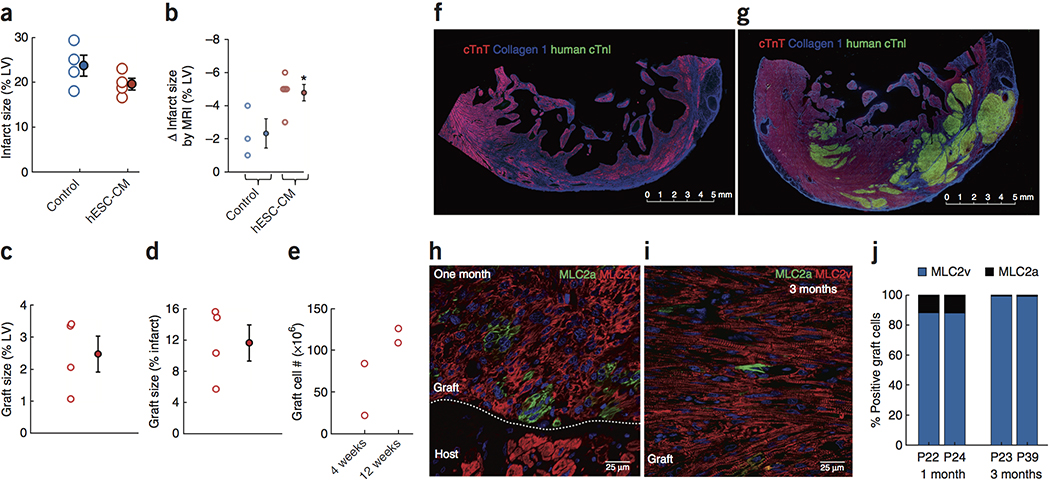
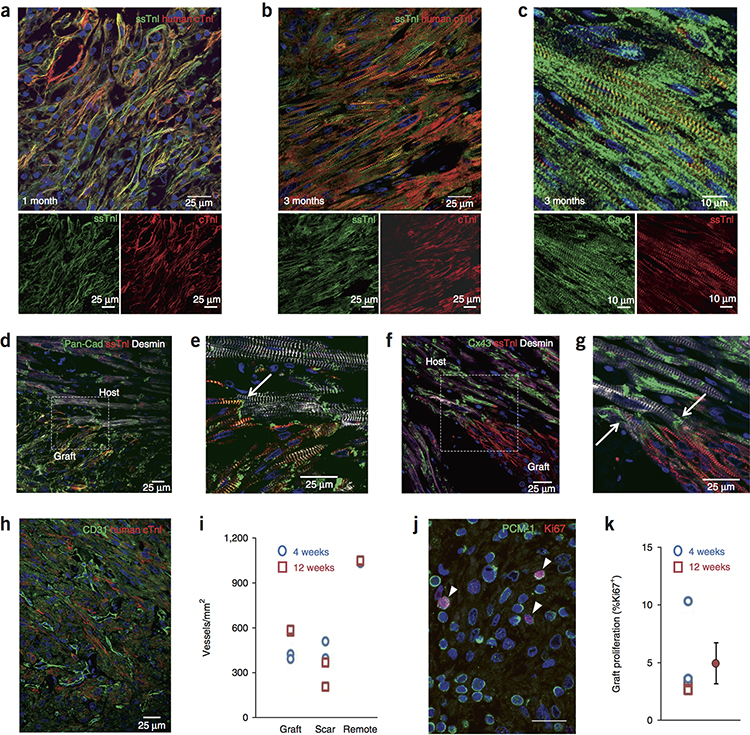
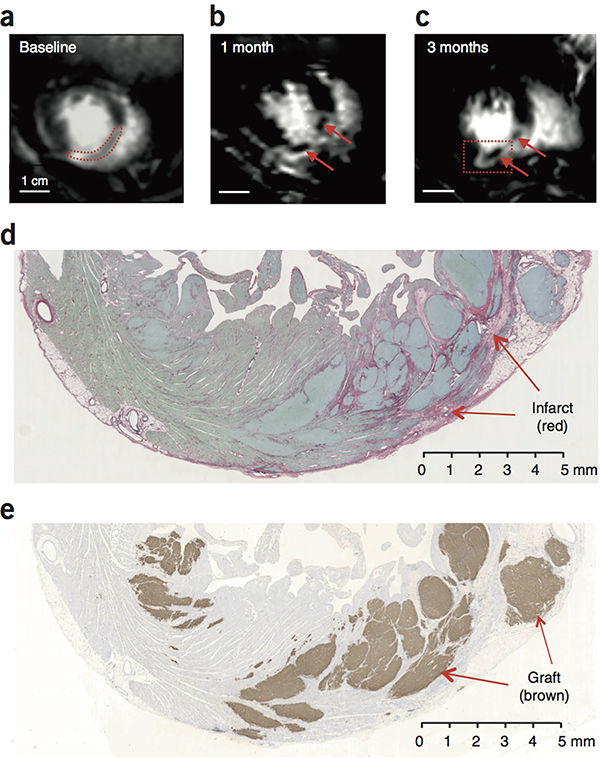
Pluripotent stem cell-derived cardiomyocyte grafts can remuscularize substantial amounts of infarcted myocardium and beat in synchrony with the heart, but in some settings cause ventricular arrhythmias. It is unknown whether human cardiomyocytes can restore cardiac function in a physiologically relevant large animal model. Here we show that transplantation of ∼750 million cryopreserved human embryonic stem cell-derived cardiomyocytes (hESC-CMs) enhances cardiac function in macaque monkeys with large myocardial infarctions. One month after hESC-CM transplantation, global left ventricular ejection fraction improved 10.6 ± 0.9% vs. 2.5 ± 0.8% in controls, and by 3 months there was an additional 12.4% improvement in treated vs. a 3.5% decline in controls. Grafts averaged 11.6% of infarct size, formed electromechanical junctions with the host heart, and by 3 months contained ∼99% ventricular myocytes. A subset of animals experienced graft-associated ventricular arrhythmias, shown by electrical mapping to originate from a point-source acting as an ectopic pacemaker. Our data demonstrate that remuscularization of the infarcted macaque heart with human myocardium provides durable improvement in left ventricular function.


Conflict of interest statement

Competing Interest Declaration

Drs. Murry, Thies and MacLellan are scientific founders and equity holders in Cytocardia.

Figures

Figure 1
Figure 1. Effects of hESC-CM Transplantation on Cardiac Function
(a) Timeline for the efficacy study in which non-human primates received 180 minute ischemia/reperfusion in the mid LAD vascular bed. Cardiac MRI is incorporated to measure cardiac dimensions and function. Electrophysiology studies are also included in the protocol to study the cause, inducibility, and severity of the ventricular arrhythmias. (b) A representative stain of a short-axis cross section of an infarcted NHP control heart with picrosirius red and fast green, where the infarct collagen is red and healthy myocardium is green. The infarct is transmural, with sparing of subendocardial myocardium. These experiments were repeated 4 times for controls and 5 times for hESC-CM treatment, with similar results. Scale bar, 5 mm. (c) Representative short-axis CINE MRI at end-diastolic and end-systolic phases of the cardiac cycle at 4 weeks after treatment (6 weeks after MI). Blood in the chamber appears bright. There is greater ejection of blood in the hESC-CM heart during systole. These experiments were repeated 4 times for controls and 5 times for hESC-CM treatment, with similar results. Scale bar, 1 cm. (d) Plot of left ventricular ejection fraction (LVEF) for individual subjects (4 control animals, blue; 5 hESC-CM treated animals, red) prior to infarction (Pre-MI), at the post-infarction baseline (one day prior to injection) and at 1 month post treatment. All hESC-CM hearts show significant improvement, while there is minimal improvement in controls. (e) Mean LVEF is comparable between groups prior to infarction and at post-infarction baseline but shows a significant improvement after hESC-CM treatment (*P=0.004, paired t-test, df=4). Data are from 4 biologically independent control animals and 5 hESC-CM treated animals. Bars represent mean ± SEM. Individual data points are shown in 1d. (f) Change in LVEF (ΔLVEF) from baseline to 4 weeks is significantly greater in hESC-CM hearts than in controls Data are from 4 biologically independent control animals and 5 hESC-CM treated animals. Bars represent mean ± SEM. (*P=0.004, 2-tailed t-test, df=7). (g) There is a variable trend (P=0.135, paired t-test, df=7) 4) toward increased systolic thickening of the infarcted wall in hESC-CM treated animals. Data are from 4 biologically independent control animals and 5 hESC-CM treated animals. Bars represent mean ± SEM. (h) Extending survival to 12 weeks demonstrates a modest reduction in LVEF in control hearts and further improvement with hESC-CM treatment. This suggests the benefits seen at 4 weeks are stable with the potential for substantial further improvement.
Figure 2
Figure 2. Analysis of Arrhythmias
(a–d) Electrocardiograms from telemetry analysis of 4 biologically independent control animals and 5 hESC-CM treated animals demonstrating normal sinus rhythm (a), non-sustained ventricular tachycardia (b), sustained ventricular tachycardia (c), and sustained accelerated idioventricular rhythm (d). (e, f) Spontaneous ventricular arrhythmias in large infarct protocol (3-hour mid-LAD occlusion) for 4 biologically independent control animals (e) and 5 individual control (e) and hESC-CM treated animals (f) were recorded as hours/day (24hrs). Both groups have ventricular arrhythmias before and after injection (day 0), but the hESC-CM group had one subject with protracted arrhythmias (arrow), that likely are treatment-related. (g) Programmed electrical stimulation studies demonstrate that the inducibility and severity between biologically independent control (N=3) and hESC-CM treated hearts (N=5) were not significantly different(P=0.816, 2-tailed t-test, df=6 for inducibility; P=0.411, 2-tailed t-test, df=6 for severity). Group data indicate mean ± SEM. (h, i) Electrical activation maps acquired using an endocardial catheter electrode. Red = early activation; magenta = late activation (h) Activation in a non-infarcted macaque heart initiates at the apex (red; pointing toward the observer) and spreads toward the base. N=1. (i) Activation map from an hESC-CM-engrafted heart during spontaneous ventricular tachycardia, with apex pointing toward lower right. Activation originates from an apparent point source in the anterior septum. No rotor was identified. This experiment was independently repeated twice with similar results.
Figure 3
Figure 3. Structural assessment of infarct, graft size and graft composition
(a) Histological infarct size was not different between groups at the end of the study. Each point is one heart. Data are from 4 biologically independent control animals and 5 hESC-CM treated animals. Group data are means ± SEM. (b) Scar shrinkage by MRI from baseline to 4 weeks was significantly greater in hESC-CM hearts. Group data are means ± SEM. (c, d) Histological graft size expressed as a percentage of left ventricle and of the infarct. Data are from 4 biologically independent hESC-CM treated animals. Group data are means ± SEM. (e) Graft cell number determined by histomorphometry. Note the increase in cell number from 4 to 12 weeks. Each point represents 1 heart, with 2 biologically independent replicates at each of 4 and 12 weeks. (f, g) Low magnification immunofluorescent images stained for cardiac troponin T (cTnT; red; human + monkey myocardium), human-specific cardiac troponin I (human cTnI; green; human myocardium) and type I collagen to identify scar tissue (blue). (f) Control heart showing transmural infarct and lateral border zone. Note the spared host subendocardial myocardium and the thinned infarct wall compared to the border zone. This experiment was repeated in 4 biologically independent control animals with similar results. Scale bar, 5 mm. (g) hESC-CM engrafted heart showing large islands of human myocardium (green) within the infarct and lateral border zone. Note the relative preservation of wall thickness in the infarct region. This experiment was repeated in 5 biologically independent hESC-CM treated hearts, with similar results in 4. In 1 animal the graft was lost after 4 weeks due to interruption of immunosuppression. Scale bar, 5 mm. (h, i) Graft staining for definitive ventricular phenotype (MLC2v, red) or immature ventricular/atrial/nodal cardiomyocyte phenotype (MLC2a, green). (h) At 1 month post-engraftment, the majority of graft cells express MLC2v, but MLC2a+ cells are readily identified. Note that host cardiomyocytes express only MLC2v. This experiment was repeated in 2 biologically independent hESC-CM treated hearts, with similar results. Scale bar, 25 μm. (i) At 3 months post-engraftment the graft is comprised almost entirely of definitive ventricular cardiomyocytes, and only rare MLC2a+ cells can be identified. This experiment was repeated in 2 biologically independent hESC-CM treated hearts, with similar results. Scale bar, 25 μm. (j) Quantitation of MLC2v and MLC2a staining. At 3 months both grafts are 99% MLC2v+. Each bar represents 1 animal.
Figure 4
Figure 4. Graft maturation, integration, vascularization and proliferation
(a, b) hESC-CM grafts stained for slow skeletal troponin I (ssTnI, green) and human cardiac troponin I (cTnI, red). Merged image on top, individual channels below. Scale bar, 25 μm. (a) At 1 month the hESC-CMs are relatively small, have peripheral myofibrils and exhibit low cellular alignment. Low level expression of cTnI is evident. This experiment was repeated in 2 biologically independent hESC-CM treated hearts with similar results. (b) At 3 months the cells have hypertrophied, have myofibrils throughout the cytoplasm and are better aligned. Increased expression of cTnI is evident. This experiment was repeated in 2 biologically independent hESC-CM treated hearts with similar results. (c) At 3 months, graft T-tubule networks are present, shown by caveolin-3 staining (Cav3, green). ssTnI, red. This experiment was repeated in 2 biologically independent hESC-CM treated hearts with similar results. Scale bar, 10 μm. (d) Interface of 3-month graft and host myocardium stained for pan-cadherin (green), ssTnI (human graft, red) and desmin (graft + host, white). This experiment was repeated in 2 biologically independent hESC-CM treated hearts with similar results. Scale bar, 25 μm. (e) Magnified image of region boxed in (d) demonstrates cadherin-positive adherens junction at intercalated disk between graft and host (arrow). This experiment was repeated in 2 biologically independent hESC-CM treated hearts with similar results. Scale bar, 25 μm. (f) Interface of 3-month graft and host myocardium stained for connexin43 (Cx43, green), ssTnI (human graft, red) and desmin (graft + host, white). This experiment was repeated in 2 biologically independent hESC-CM treated hearts with similar results. Scale bar, 25 μm. (g) Magnified image of region boxed in (f) demonstrates connexin43-positive gap junctions at intercalated disks between graft and host (arrows). This experiment was repeated in 2 biologically independent hESC-CM treated hearts with similar results. Scale bar, 25 μm. (h) Vascularization of the human myocardium (human cTnI-positive, red) by host microvessels is demonstrated by staining endothelial cells for CD31 (green). This experiment was repeated in 4 biologically independent hESC-CM treated hearts with similar results. Scale bar, 25 μm. (i) Quantitation of vascular density in graft, scar and remote myocardium at 4 and 12 weeks. Each point is 1 heart. Data are from 4 biologically independent control animals and 4 hESC-CM treated animals. (j) Proliferation of 4-week hESC-CM graft demonstrated by staining for pericentriolar material-1 (PCM-1; green) and Ki67 (red). Cardiomyocyte nuclei in cell cycle are indicated by arrowheads. This experiment was repeated in 4 biologically independent hESC-CM treated hearts with similar results. Scale bar, 20 μm. (k) Quantitation of graft cardiomyocyte proliferation at 4 weeks and 12 weeks. Each point is 1 heart. Data are from 2 biologically independent hESC-CM treated hearts each at 2 and 4 weeks. Group data are mean ± SEM for all 4 hearts.
Figure 5
Figure 5
Visualization of grafts by MRI. (a–c) Delayed Gd enhanced MR images of macaque heart to identify the infarct scar. Blood in the chambers appears bright. Viable myocardium appears dark, and infarcted tissue appears light gray. The same short-axis region of the heart is shown in each scan. (a) At baseline, the infarct is a homogeneous tissue located in the anterior wall and interventricular septum (outlined by red dotted line). (b, c) At 1 month and 3 months post-engraftment, new areas of viable dark (Gd-negative) tissue appear within the infarct (arrows). (d) Histological section corresponding to the region boxed in (c) stained with picrosirius red to identify collagen and fast green to identify myocardium. Infarct scar is readily identifiable as red tissue, but it contains islands of green tissue consistent with myocardium. Scale bar, 5 mm. (e) Adjacent section from region boxed in (c) stained for human cTnT (brown) to identify human myocardial graft. There is extensive human myocardium within the infarct and in the lateral border zone, measuring >1 cm in maximal dimension. Note that human myocardium within the scar would be visible by MRI, but grafts in the border zone host myocardium would be MRI-invisible, since both exclude Gd. This experiment was repeated 4 times with biologically independent hESC-CM treated animals, with similar results found in 3. In 1 animal, the graft could not reliably be distinguished by MRI.

Comment in

References

    1. Forouzanfar MH, et al. Assessing the global burden of ischemic heart disease, part 2: analytic methods and estimates of the global epidemiology of ischemic heart disease in 2010. Glob Heart. 2012;7:331–342. - PMC - PubMed
    1. Laflamme MA, Murry CE. Heart regeneration. Nature. 2011;473:326–335. - PMC - PubMed
    1. Eschenhagen T, et al. Cardiomyocyte Regeneration: A Consensus Statement. Circulation. 2017;136:680–686. - PMC - PubMed
    1. Bergmann O, et al. Evidence for cardiomyocyte renewal in humans. Science. 2009;324:98–102. - PMC - PubMed
    1. Soonpaa MH, Field LJ. Survey of studies examining mammalian cardiomyocyte DNA synthesis. Circ Res. 1998;83:15–26. - PubMed

Publication types