Air-quality-related health impacts from climate change and from adaptation of cooling demand for buildings in the eastern United States: An interdisciplinary modeling study
- PMID: 29969461
- PMCID: PMC6029751
- DOI: 10.1371/journal.pmed.1002599
Air-quality-related health impacts from climate change and from adaptation of cooling demand for buildings in the eastern United States: An interdisciplinary modeling study
Abstract
Background: Climate change negatively impacts human health through heat stress and exposure to worsened air pollution, amongst other pathways. Indoor use of air conditioning can be an effective strategy to reduce heat exposure. However, increased air conditioning use increases emissions of air pollutants from power plants, in turn worsening air quality and human health impacts. We used an interdisciplinary linked model system to quantify the impacts of heat-driven adaptation through building cooling demand on air-quality-related health outcomes in a representative mid-century climate scenario.
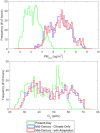
Methods and findings: We used a modeling system that included downscaling historical and future climate data with the Weather Research and Forecasting (WRF) model, simulating building electricity demand using the Regional Building Energy Simulation System (RBESS), simulating power sector production and emissions using MyPower, simulating ambient air quality using the Community Multiscale Air Quality (CMAQ) model, and calculating the incidence of adverse health outcomes using the Environmental Benefits Mapping and Analysis Program (BenMAP). We performed simulations for a representative present-day climate scenario and 2 representative mid-century climate scenarios, with and without exacerbated power sector emissions from adaptation in building energy use. We find that by mid-century, climate change alone can increase fine particulate matter (PM2.5) concentrations by 58.6% (2.50 μg/m3) and ozone (O3) by 14.9% (8.06 parts per billion by volume [ppbv]) for the month of July. A larger change is found when comparing the present day to the combined impact of climate change and increased building energy use, where PM2.5 increases 61.1% (2.60 μg/m3) and O3 increases 15.9% (8.64 ppbv). Therefore, 3.8% of the total increase in PM2.5 and 6.7% of the total increase in O3 is attributable to adaptive behavior (extra air conditioning use). Health impacts assessment finds that for a mid-century climate change scenario (with adaptation), annual PM2.5-related adult mortality increases by 13,547 deaths (14 concentration-response functions with mean incidence range of 1,320 to 26,481, approximately US$126 billion cost) and annual O3-related adult mortality increases by 3,514 deaths (3 functions with mean incidence range of 2,175 to 4,920, approximately US$32.5 billion cost), calculated as a 3-month summer estimate based on July modeling. Air conditioning adaptation accounts for 654 (range of 87 to 1,245) of the PM2.5-related deaths (approximately US$6 billion cost, a 4.8% increase above climate change impacts alone) and 315 (range of 198 to 438) of the O3-related deaths (approximately US$3 billion cost, an 8.7% increase above climate change impacts alone). Limitations of this study include modeling only a single month, based on 1 model-year of future climate simulations. As a result, we do not project the future, but rather describe the potential damages from interactions arising between climate, energy use, and air quality.
Conclusions: This study examines the contribution of future air-pollution-related health damages that are caused by the power sector through heat-driven air conditioning adaptation in buildings. Results show that without intervention, approximately 5%-9% of exacerbated air-pollution-related mortality will be due to increases in power sector emissions from heat-driven building electricity demand. This analysis highlights the need for cleaner energy sources, energy efficiency, and energy conservation to meet our growing dependence on building cooling systems and simultaneously mitigate climate change.
Conflict of interest statement
I have read the journal’s policy and the authors of this manuscript have the following competing interests: PM has an ownership interest in the MyPower model used to generate power plant emissions estimates for this study. The data from this study are publicly available. JAP served as a Guest Editor on PLOS Medicine's Special Issue on Climate Change and Health.
Figures


References
-
- Patz JA, Frumkin H, Holloway T, Vimont DJ, Haines A. Climate change: challenges and opportunities for global health. JAMA. 2014;312:1565–80. doi: 10.1001/jama.2014.13186 - DOI - PMC - PubMed
-
- Watts N, Amann M, Ayeb-Karlsson S, Belesova K, Bouley T, Boykoff M, et al. The Lancet Countdown on health and climate change: from 25 years of inaction to a global transformation for public health. Lancet. 2018;391(10120):581–630. doi: 10.1016/S0140-6736(17)32464-9 - DOI - PubMed
-
- Constable JVH, Guenther AB, Schimel DS, Monson RK. Modelling changes in VOC emission in response to climate change in the continental United States. Glob Change Biol. 1999;5:791–806. doi: 10.1046/j.1365-2486.1999.00273.x - DOI
-
- Guenther A. Seasonal and spatial variations in natural volatile organic compound emissions. Ecol Appl. 1997;7:34–45.
-
- Sillman S, Samson PJ. Impact of temperature on oxidant photochemistry in urban, polluted rural and remote environments. J Geophys Res. 1995;100:11497–508. doi: 10.1029/94JD02146 - DOI
Publication types
MeSH terms
Substances
Grants and funding
LinkOut - more resources
Full Text Sources
Other Literature Sources
Medical
Research Materials

