. 2018;12(5):472-488.
doi: 10.1080/19336918.2018.1475803. Epub 2018 Aug 28.

Behavioral remodeling of normal and cancerous epithelial cell lines with differing invasion potential induced by substrate elastic modulus

Affiliations

Behavioral remodeling of normal and cancerous epithelial cell lines with differing invasion potential induced by substrate elastic modulus

Arian Ansardamavandi et al. Cell Adh Migr. 2018.

Abstract

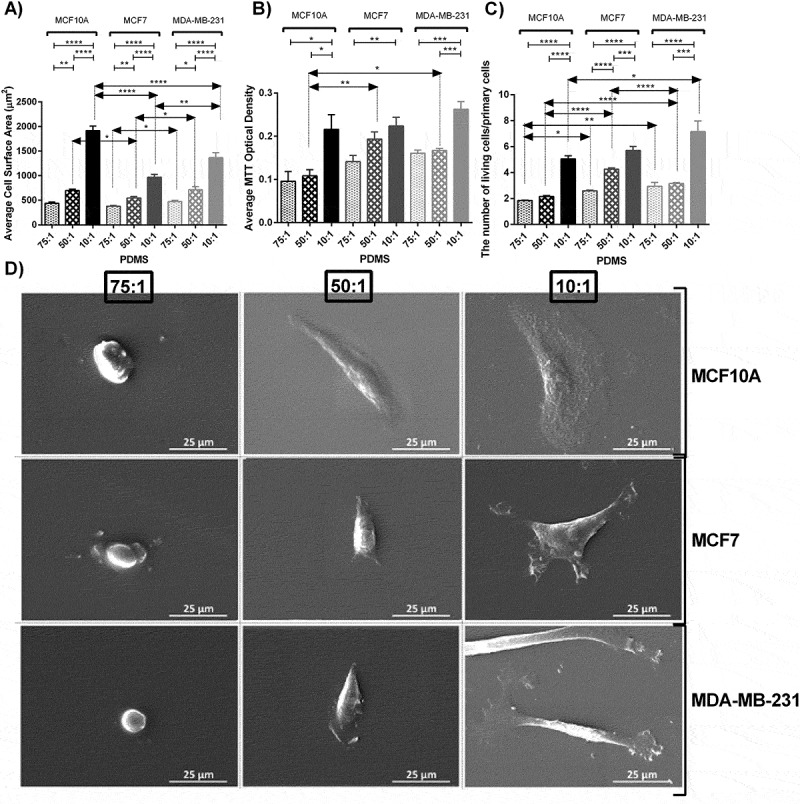
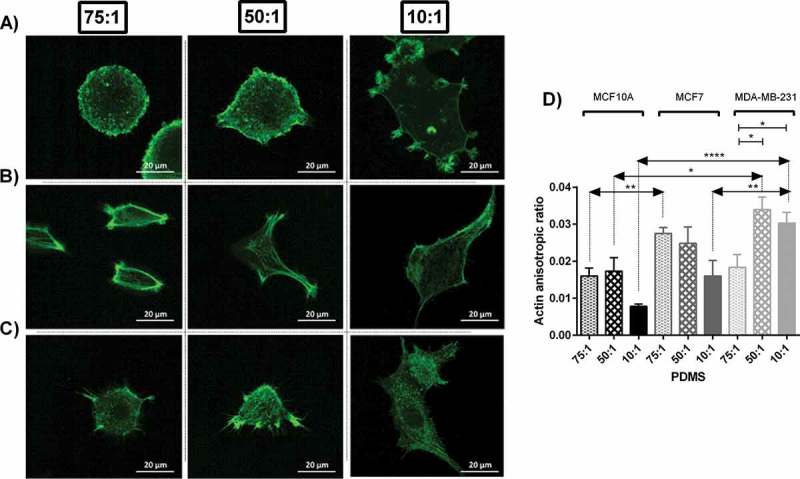
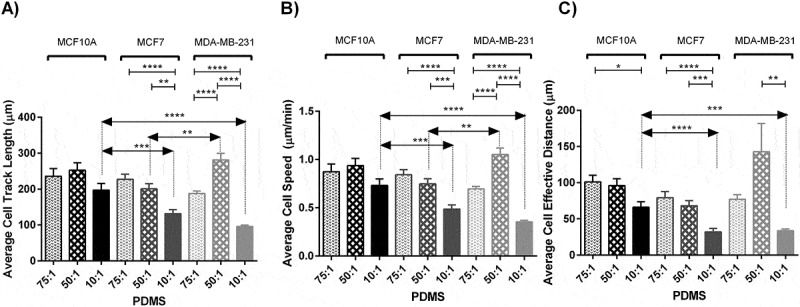
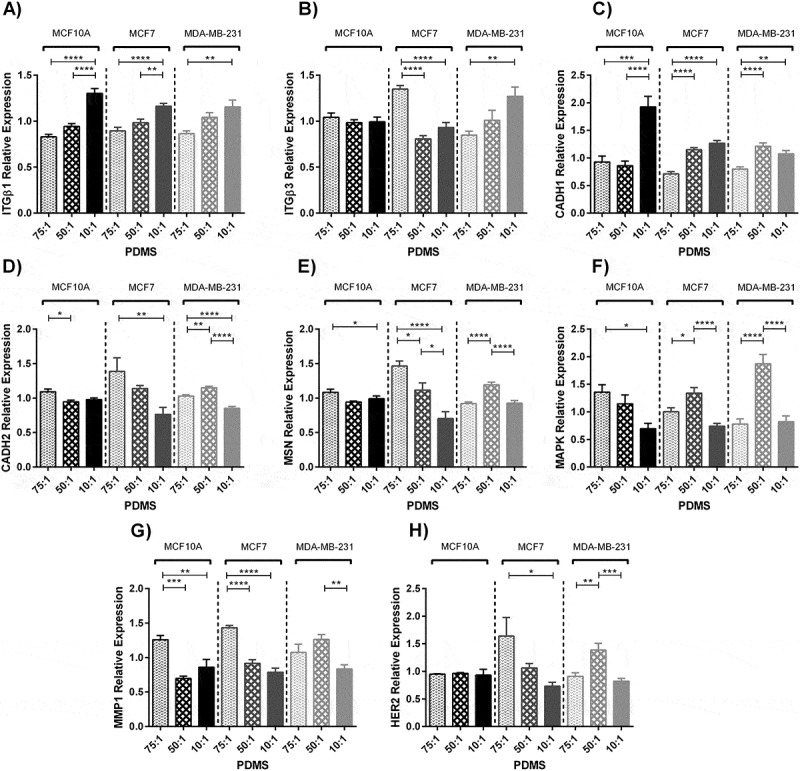
The micro-environment of cancer cells in the body is mechanically stiffer than that of normal cells. We cultured three breast cell lines of MCF10A-normal, MCF7-noninvasive, and MDA-MB-231-invasive on PDMS substrates with different elastic moduli and different cellular features were examined.Effects of substrate stiffness on cell behavior were evident among all cell lines. Cancerous cells were more sensitive to substrate stiffness for cell behaviors related to cell motility and migration which are necessary for invasion. The invasive cancerous cells were the most motile on substrates with moderate stiffness followed by non-invasive cancerous cells. Gene markers alterations were generally according to the analyzed cell movement parameters. Results suggest that alterations in matrix stiffness may be related to cancer disease and progression.

Keywords: Substrate Stiffness; different invasiveness; gene expression; mammary cancer cell lines; morphology; motility; proliferation.


Figures

Figure 1.
Figure 1.
Morphological analysis, proliferation assay and SEM images of MC10A, MCF7 and MDA-MB-231 cell lines cultured on substrates with different elastic moduli. A) Average cellular surface area of different breast cell lines cultured on substrates with different rigidities using Image J software. B) Average cellular proliferation index of different breast cell lines cultured on substrates with different rigidities using MTT assay. C) Direct living cell counting using trypan blue. The number of cells after 48 h culture was divided by the number of primary cells (50,000 cells in each well of 6 well plates in the first day of culture) . D) Scanning electron microscopic (SEM) images of different breast cell lines cultured on substrate with different rigidities. In each case, values represent the mean (± SEM) of measurements from three independent experiments (*P < 0.05, **P < 0.01, ***P < 0.001 and ****P < 0.0001).
Figure 2.
Figure 2.
Actin cytoskeletal staining of MC10A, MCF7 and MDA-MB-231 cell lines cultured on substrates with different stiffness values. (A, B, C) Represents confocal images of cells on each substrate stained by phalloidin-FITC. (A) MCF10A. (B) MCF7. (C) MDA-MB-231. (D) Actin anisotropic ratio of breast cell lines cultured on substrates with different stiffness values.
Figure 3.
Figure 3.
Analyzing cell movement parameters of MC10A, MCF7 and MDA-MB-231 cell lines cultured on substrates with different stiffness values. (A) Represents average cell track length of different breast cancer cell lines cultured on substrates with different rigidities. (B) Represents average cell speed of different breast cancer cell lines cultured on substrates with different rigidities. (C) Represents average cell effective distance of different breast cancer cell lines cultured on substrates with different rigidities. In each case, values represent the mean (± SEM) of measurements from three independent experiments (*P < 0.05, **P < 0.01, ***P < 0.001 and ****P < 0.0001).
Figure 4.
Figure 4.
Quantification of gene expression of three breast cell lines cultured on prepared substrates with different rigidities for 2 days using real time PCR. (A, B, C, D, E, F, G, H) Represents relative gene expression of different breast cancer cell lines cultured on substrates with different elastic moduli. (A) Integrin β1. (B) Integrin β3. (C) E-cadherin. (D) N-cadherin. (E) Moesin. (F) Mitogen-activated protein kinase 1. (G) Matrix metalloproteinase1. (H) Human epidermal growth factor receptor 2. In each case, values represent the mean (± SEM) of quantification in three independent experiments (*P < 0.05, **P < 0.01, ***P < 0.001 and ****P < 0.0001).

References

    1. Senkus E.et al. Primary breast cancer: ESMO Clinical Practice Guidelines for diagnosis, treatment and follow-up. Ann Oncol. 2015;26,v8–v30. - PubMed
    1. Boyd NF, Li Q, Melnichouk O, et al. Evidence that breast tissue stiffness is associated with risk of breast cancer. PloS One. 2014;9:e100937. - PMC - PubMed
    1. Ansardamavandi A, Tafazzoli-Shadpour M, Omidvar R, et al. Quantification of effects of cancer on elastic properties of breast tissue by atomic force microscopy. J Mech Behav Biomed Mater. 2016;60:234–242. - PubMed
    1. Ingber DE. Can cancer be reversed by engineering the tumor microenvironment? Seminars in cancer biology: Elsevier, 2008356–364. - PMC - PubMed
    1. Schrader J, Gordon‐Walker TT, Aucott RL, et al. Matrix stiffness modulates proliferation, chemotherapeutic response, and dormancy in hepatocellular carcinoma cells. Hepatology. 2011;53:1192–1205. - PMC - PubMed