. 2018 Jul 3;12(1):75.
doi: 10.1186/s12918-018-0597-3.

Short linear motifs in intrinsically disordered regions modulate HOG signaling capacity

Affiliations

Short linear motifs in intrinsically disordered regions modulate HOG signaling capacity

Bob Strome et al. BMC Syst Biol. .

Abstract

Background: The effort to characterize intrinsically disordered regions of signaling proteins is rapidly expanding. An important class of disordered interaction modules are ubiquitous and functionally diverse elements known as short linear motifs (SLiMs).

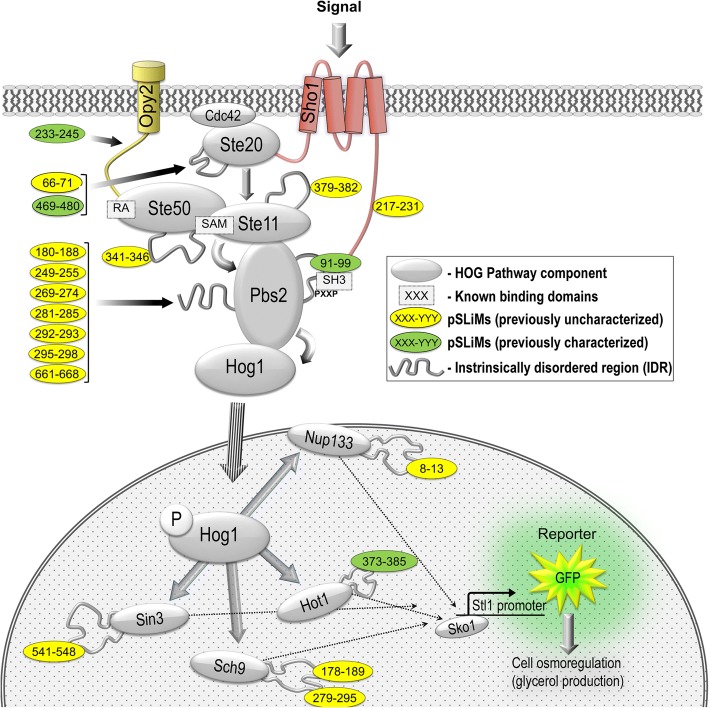
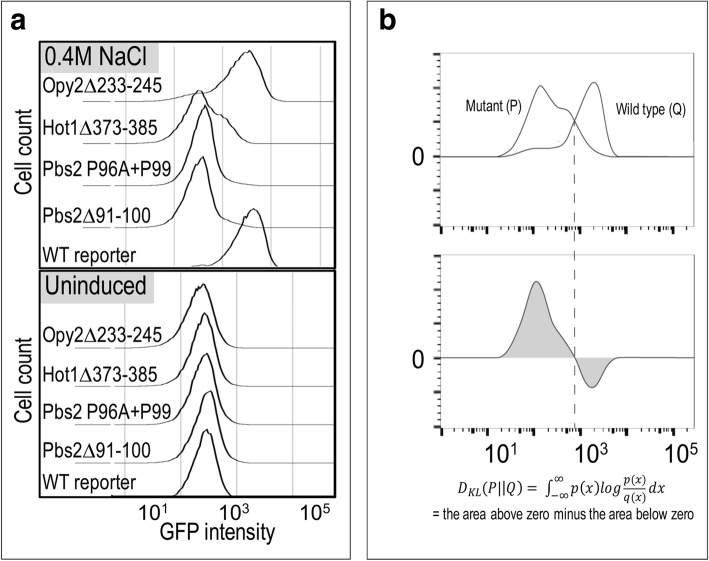
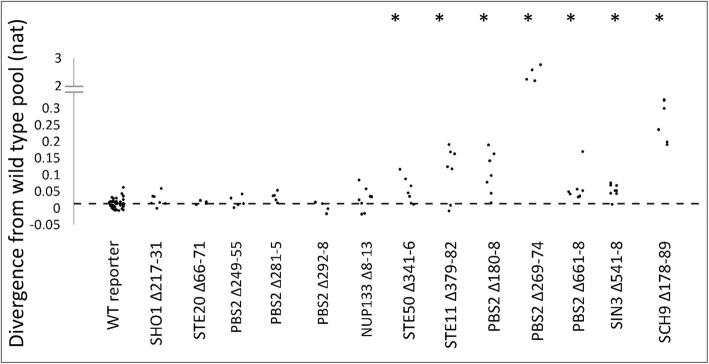
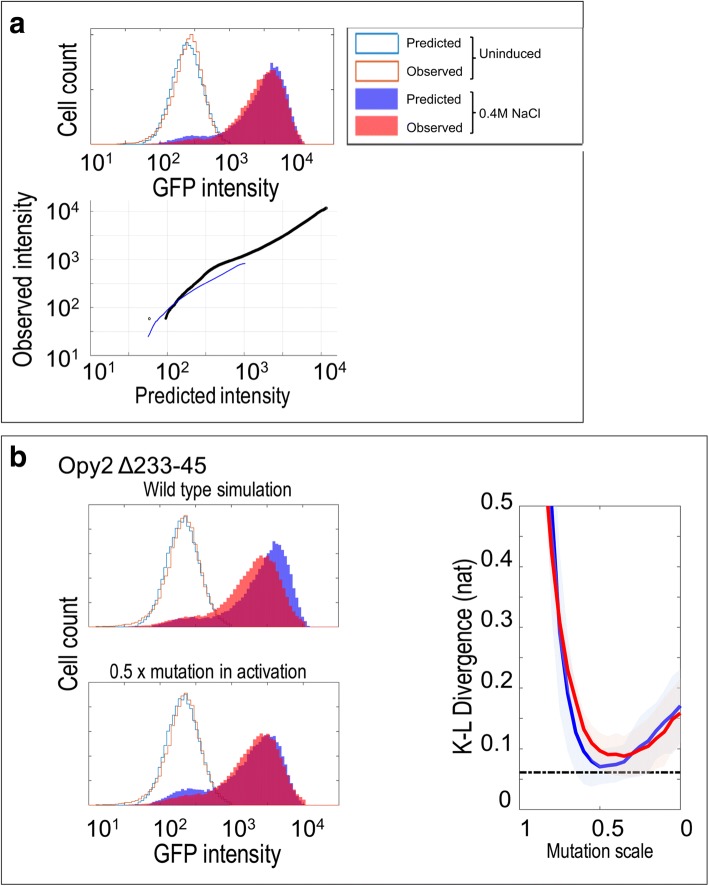
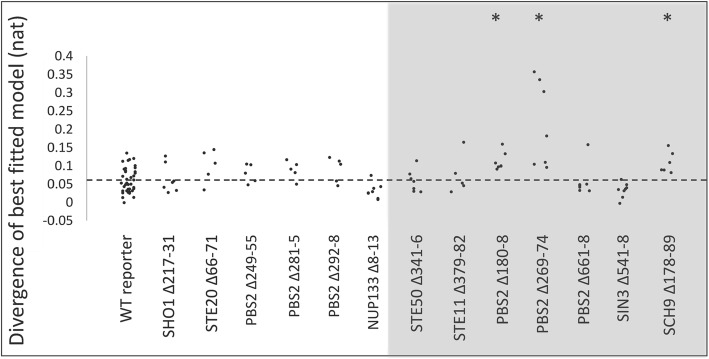
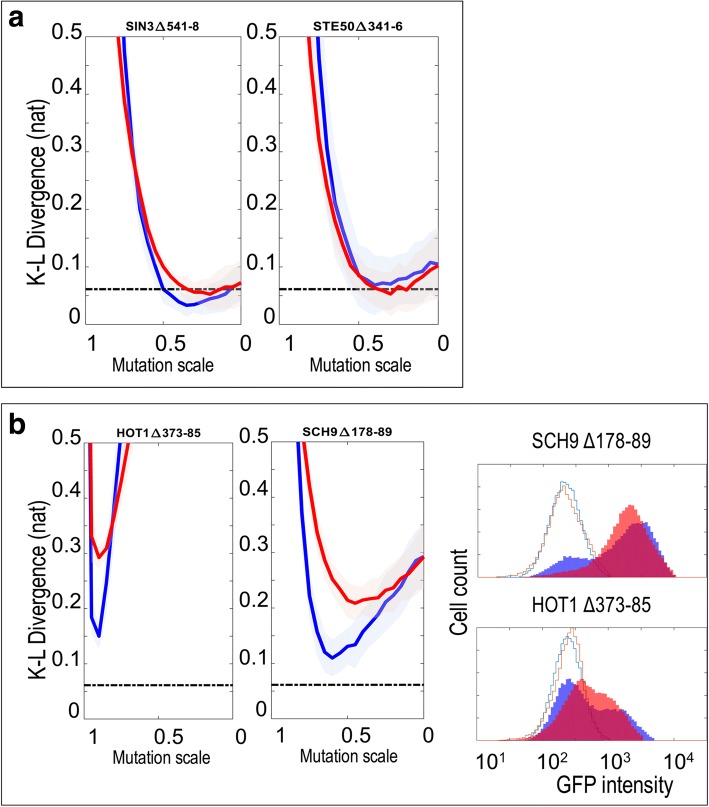
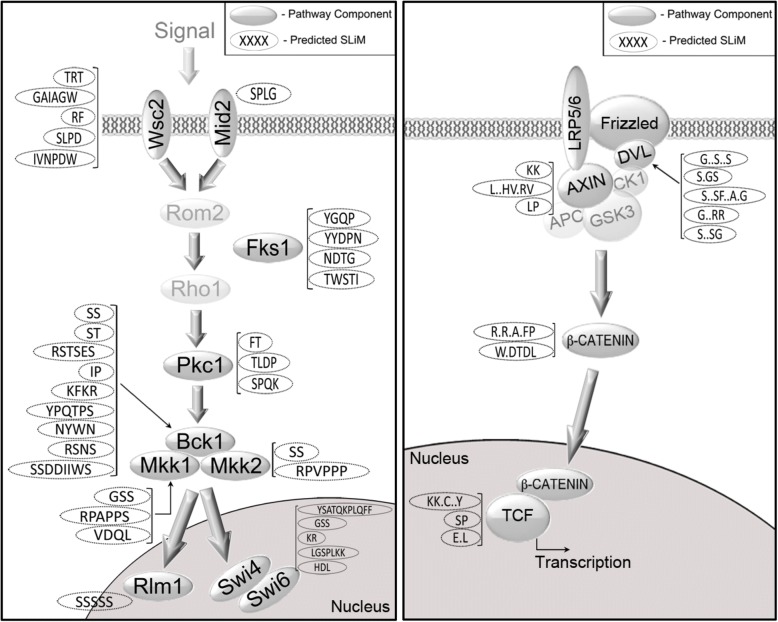
Results: To further examine the role of SLiMs in signal transduction, we used a previously devised bioinformatics method to predict evolutionarily conserved SLiMs within a well-characterized pathway in S. cerevisiae. Using a single cell, reporter-based flow cytometry assay in conjunction with a fluorescent reporter driven by a pathway-specific promoter, we quantitatively assessed pathway output via systematic deletions of individual motifs. We found that, when deleted, 34% (10/29) of predicted SLiMs displayed a significant decrease in pathway output, providing evidence that these motifs play a role in signal transduction. Assuming that mutations in SLiMs have quantitative effects on mechanisms of signaling, we show that perturbations of parameters in a previously published stochastic model of HOG signaling could reproduce the quantitative effects of 4 out of 7 mutations in previously unknown SLiMs.

Conclusions: Our study suggests that, even in well-characterized pathways, large numbers of functional elements remain undiscovered, and that challenges remain for application of systems biology models to interpret the effects of mutations in signaling pathways.

Keywords: Cell signaling; High osmotic glycerol pathway; Intrinsically disordered regions; Mitogen-activated kinases; Saccharomyces cerevisiae; Short linear motifs.


Conflict of interest statement

Ethics approval and consent to participate

Not applicable

Consent for publication

Not applicable

Competing interests

The authors declare that they have no competing interests.

Publisher’s Note

Springer Nature remains neutral with regard to jurisdictional claims in published maps and institutional affiliations.

Figures

Fig. 1
Fig. 1
Schematic diagram of the Sho1-dependant branch of the yeast high osmolarity glycerol (HOG) pathway as a model system for analysis of short linear motif function in signal transduction. Upon exposure to high osmolarity, the SH3 domain of the membrane-bound osmosensor Sho1 binds to PXXP motif in the MAPK kinase (MAPKK) Pbs2, initiating a phosphorylation cascade (grey arrows) that culminates in phosphorylation of the MAPK Hog1. Activated Hog1-P then accumulates inside the nucleus and initiates a complex transcriptional response in order to re-establish homeostasis within the cell. A Hog1-responsive promoter driving yeGFP reporter expression was used to quantify pathway activity for a series of deletions in predicted short linear motifs in pathway components – deleted residues shown in ovals for each module
Fig. 2
Fig. 2
Deletions of known short linear motifs impairs HOG pathway-specific reporter activation. a. Histograms of flow cytometry data showing expression of GFP driven by a Hog1-specific promoter (Stl1) before (lower panel) and after (upper panel) a 60 min induction with 0.4 M NaCl. Pbs2: both a 10 residue deletion (Δ91–100) and double point mutant (P96A + P99A) of SH3 binding domain essentially eliminates reporter output; Hot1: (glycerol biosynthesis transcription factor) 13 residue deletion of a known activation domain (373–385) substantially impairs pathway output - and effects a measurable bimodal distribution; Opy2: 13 residue deletion of known Ste50 binding domain (233–245) effects a partial reduction in reporter output. b. Comparison of distributions using the KL divergence, DKL(P ∣ |Q). The top panel shows cartoon distributions representing either mutant (P) or wild-type (Q) flow cytometry data. The bottom panel shows the log ratio of the two distributions weighted by the probability under the mutant. The KL divergence (equation below the bottom panel) is the integral of this curve (grey area). Dashed line shows that when P(x) and Q(x) have the same value, there is no contribution to KL divergence
Fig. 3
Fig. 3
7/13 previously unknown short conserved elements in disordered regions are significantly diverged from wild type. Each point shows the KL divergence of a single replicate from the wild type pool. pSLiM deletion strains are indicated along the horizontal axis. Dashed line indicates the average divergence of the wild-type replicates from the wild-type pooled data (see text for details). Asterisks indicate the strains that have significantly larger KL divergences than wild type reporter (WRS; P < 0.05)
Fig. 4
Fig. 4
Simulations of a stochastic model can generate histogram data that resemble wild type and mutant distributions. a. A representative comparison between data from a wild type experimental replicate (red traces) and the prediction of the model (blue traces). The lower panel shows a QQ plot summarizing the similarity of the two distributions by comparing each quantile. The blue line indicates comparison of the Uninduced distributions (unfilled histograms in top panel), while the black line indicates comparison of the distributions after stimulation for 60 min in 0.4 M NaCl (filled histograms in the top panel) b. Comparison of an experimental replicate of Opy2∆233–45 (red traces) with predictions of the model (blue traces). The top left panel shows comparison with the wild type model, while the bottom left plot shows the same mutant data compared to the prediction of the simulation when the value of the activity parameter is decreased by 50% (indicated as 0.5×). The plot on the right summarizes how K-L divergence changes while parameter values decrease. Red lines and blue lines respectively represent the K-L divergence as the remodeling parameter and activity parameter are decreased. The shaded areas show +/− 3 times the standard errors. The dashed line is mean of wild type divergence from the wild type simulation. Compared to the histogram of induced mutant, the predicted histogram simulated with original parameters shifts toward higher intensity
Fig. 5
Fig. 5
Comparisons of KL divergence of best fitting models. Each point represents the fit of one replicate to the best fitting model for that strain. Shaded area indicates strains whose reporter expression distribution was significantly different from wild type (Fig. 3). Asterisks indicate strains whose KL divergence to the best fitting model is significantly worse than the wild type fit (WT reporter). Dashed line represents the mean of KL divergence of wild type replicates to the wild type model
Fig. 6
Fig. 6
Fitting the stochastic model to wild type and previously unknown signaling mutants. a. examples of mutants that the model can explain. Red lines and blue lines respectively represent the K-L divergence as the remodeling parameter and activity parameter are decreased. The shaded areas show +/− 3 times the standard errors. The dashed line is the mean of wild type divergence from the wild type simulation. b. Examples of mutants that the model cannot explain. The red and blue lines do not come close to the dashed line. The right panel shows comparisons of experimental replicates (red traces) to predictions of the model (blue traces) when the value of the activity parameter is decreased chosen to maximize the fit (minimize KL divergence)
Fig. 7
Fig. 7
Examples of well-characterized signaling pathways contain numerous predicted short linear motifs. Comparative proteomics analysis of yeast cell-wall integrity pathway (left) or the canonical WNT signaling pathway (right) show large numbers of predicted SLiMs

Similar articles

Cited by

References

    1. Neduva V, Russell RB. Linear motifs: evolutionary interaction switches. FEBS Lett. 2005;579:3342–3345. doi: 10.1016/j.febslet.2005.04.005. - DOI - PubMed
    1. Nguyen Ba AN, Yeh BJ, van Dyk D, Davidson AR, Andrews BJ, Weiss EL, et al. Proteome-wide discovery of evolutionary conserved sequences in disordered regions. Sci Signal. 2012;5:rs1. doi: 10.1126/scisignal.2002515. - DOI - PMC - PubMed
    1. Van Roey K, Uyar B, Weatheritt RJ, Dinkel H, Seiler M, Budd A, et al. Short linear motifs: ubiquitous and functionally diverse protein interaction modules directing cell regulation. Chem Rev. 2014;114:6733–6778. doi: 10.1021/cr400585q. - DOI - PubMed
    1. Davey NE, Van Roey K, Weatheritt RJ, Toedt G, Uyar B, Altenberg B, et al. Attributes of short linear motifs. Mol BioSyst. 2012;8:268–281. doi: 10.1039/C1MB05231D. - DOI - PubMed
    1. Dunker AK, Lawson JD, Brown CJ, Williams RM, Romero P, Oh JS, et al. Intrinsically disordered protein. J Mol Graph Model. 2001;19:26–59. doi: 10.1016/S1093-3263(00)00138-8. - DOI - PubMed

Publication types

MeSH terms

LinkOut - more resources