. 2018 Jul 4;16(1):102.
doi: 10.1186/s12916-018-1074-y.

Estimating the distribution of morbidity and mortality of childhood diarrhea, measles, and pneumonia by wealth group in low- and middle-income countries

Affiliations

Estimating the distribution of morbidity and mortality of childhood diarrhea, measles, and pneumonia by wealth group in low- and middle-income countries

Angela Y Chang et al. BMC Med. .

Abstract

Background: Equitable access to vaccines has been suggested as a priority for low- and middle-income countries (LMICs). However, it is unclear whether providing equitable access is enough to ensure health equity. Furthermore, disaggregated data on health outcomes and benefits gained across population subgroups are often unavailable. This paper develops a model to estimate the distribution of childhood disease cases and deaths across socioeconomic groups, and the potential benefits of three vaccine programs in LMICs.

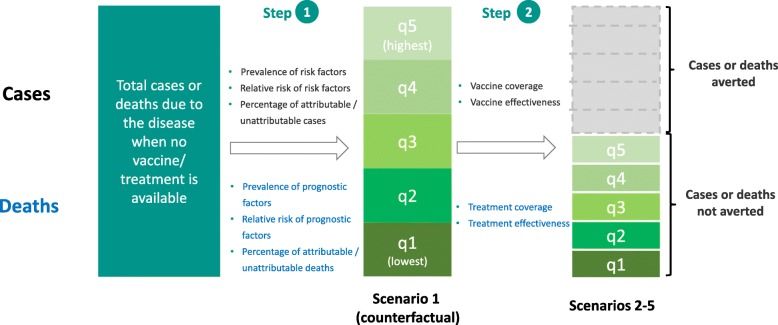
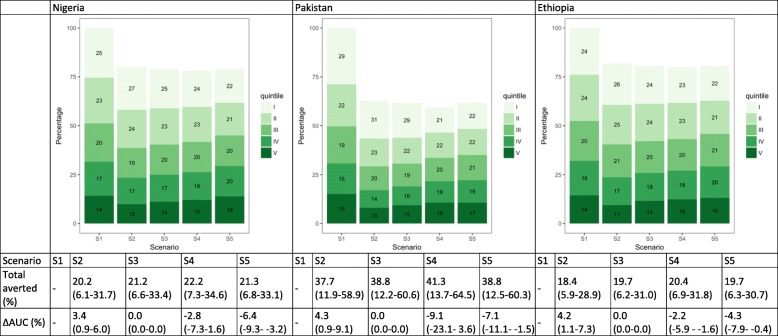
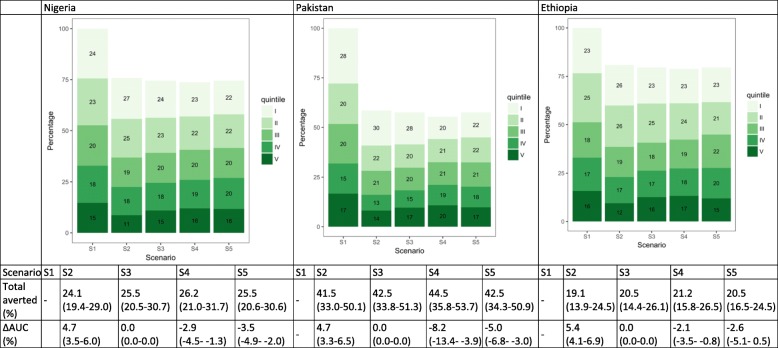
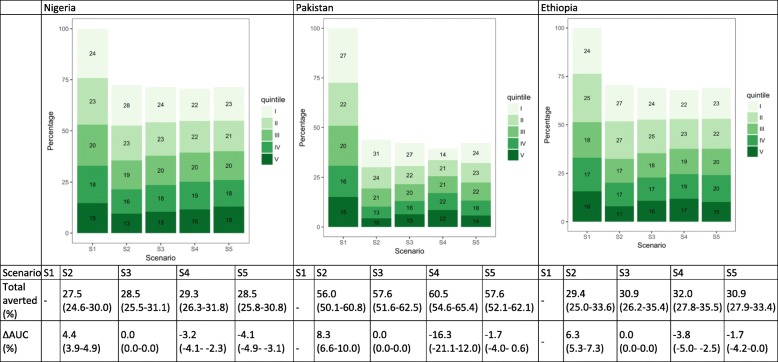
Methods: For each country and for three diseases (diarrhea, measles, pneumonia), we estimated the distributions of cases and deaths that would occur across wealth quintiles in the absence of any immunization or treatment programs, using both the prevalence and relative risk of a set of risk and prognostic factors. Building on these baseline estimates, we examined what might be the impact of three vaccines (first dose of measles, pneumococcal conjugate, and rotavirus vaccines), under five scenarios based on different sets of quintile-specific immunization coverage and disease treatment utilization rates.

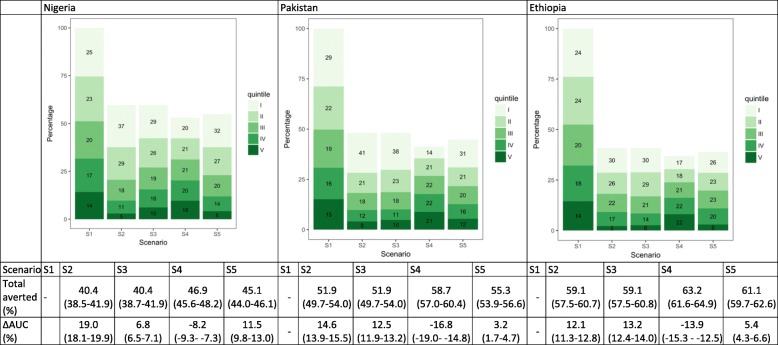
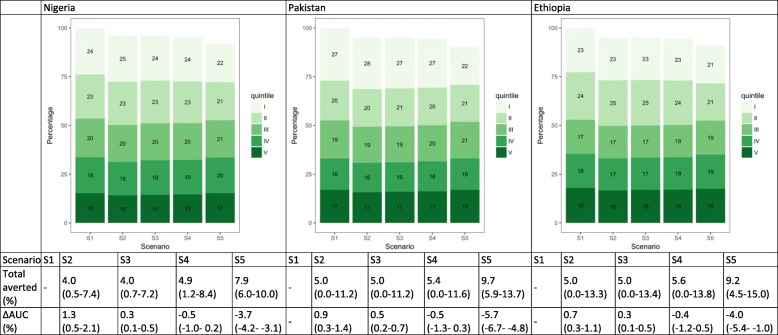
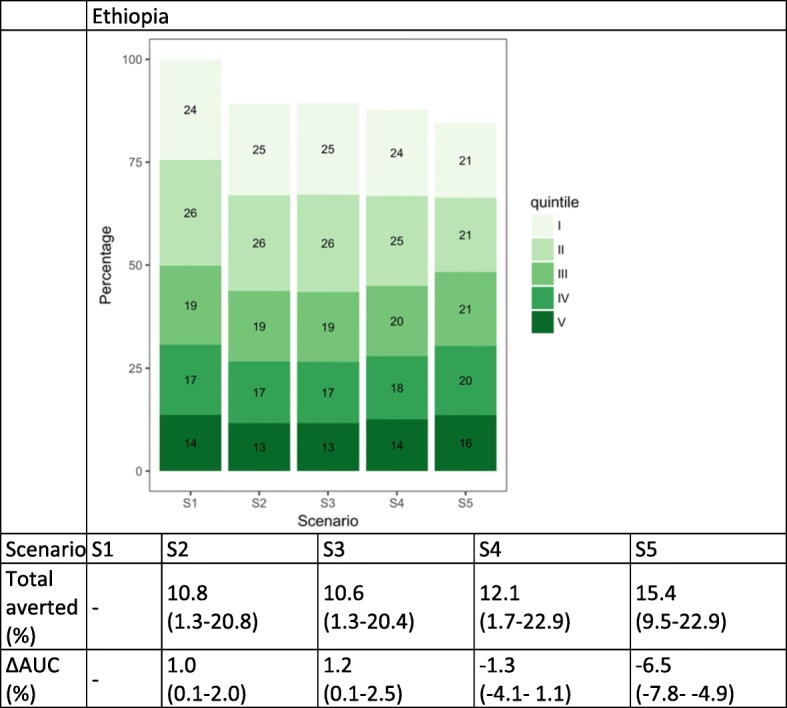
Results: Due to higher prevalence of risk factors among the poor, disproportionately more disease cases and deaths would occur among the two lowest wealth quintiles for all three diseases when vaccines or treatment are unavailable. Country-specific context, including how the baseline risks, immunization coverage, and treatment utilization are currently distributed across quintiles, affects how different policies translate into changes in cases and deaths distribution.

Conclusions: Our study highlights several factors that would substantially contribute to the unequal distribution of childhood diseases, and finds that merely ensuring equal access to vaccines will not reduce the health outcomes gap across wealth quintiles. Such information can inform policies and planning of programs that aim to improve equitable delivery of healthcare services.

Keywords: Distributional benefits; Equity; Measles vaccine; Pneumococcal conjugate vaccine; Risk factors; Rotavirus vaccine; Vaccines.


Conflict of interest statement

Competing interests

The authors declare that they have no competing interests.

Publisher’s Note

Springer Nature remains neutral with regard to jurisdictional claims in published maps and institutional affiliations.

Figures

Fig. 1
Fig. 1
Flow diagram of the analytical approach to estimate the distribution of cases/deaths of measles, diarrhea, and pneumonia under scenarios with and without vaccines/treatment
Fig. 2
Fig. 2
Distribution of measles cases by wealth quintile and scenario in Nigeria, Pakistan, and Ethiopia. The numbers in the green boxes represent the percentage of cases in each wealth quintile. Wealth quintiles: I = Lowest, II = Lower, III = Middle, IV = Higher, V = Highest. AUC = area under the curve. ∆ AUC: Percent change in AUC compared to Scenario 1 (S1). 95% uncertainty ranges are indicated in parentheses. (S1): no vaccine program available; S2: current vaccine program; S3: total number of vaccines from S2 distributed equally across quintiles; S4: vaccine coverage proportional to quintile-specific baseline morbidity risks; S5: equal baseline morbidity risk with current quintile-specific vaccine coverage
Fig. 3
Fig. 3
Distribution of pneumonia cases by wealth quintile and scenario in Nigeria, Pakistan, and Ethiopia. The numbers in the green boxes represent the percentage of cases in each wealth quintile. Wealth quintiles: I = Lowest, II = Lower, III = Middle, IV = Higher, V = Highest. AUC = area under the curve. ∆ AUC: Percent change in AUC compared to Scenario 1 (S1). 95% uncertainty ranges are indicated in parentheses. (S1): no vaccine program available; S2: current vaccine program; S3: total number of vaccines from S2 distributed equally across quintiles; S4: vaccine coverage proportional to quintile-specific baseline morbidity risks; S5: equal baseline morbidity risk with current quintile-specific vaccine coverage
Fig. 4
Fig. 4
Distribution of diarrhea cases by wealth quintile and scenario in Ethiopia. The numbers in the green boxes represent the percentage of cases in each wealth quintile. Wealth quintiles: I = Lowest, II = Lower, III = Middle, IV = Higher, V = Highest. AUC = area under the curve. ∆ AUC: Percent change in AUC compared to Scenario 1 (S1). 95% uncertainty ranges are indicated in parentheses. (S1): no vaccine program available; S2: current vaccine program; S3: total number of vaccines from S2 distributed equally across quintiles; S4: vaccine coverage proportional to quintile-specific baseline morbidity risks; S5: equal baseline morbidity risk with current quintile-specific vaccine coverage
Fig. 5
Fig. 5
Distribution of measles deaths by wealth quintile and scenario in Nigeria, Pakistan, and Ethiopia. The numbers in the green boxes represent the percentage of deaths in each wealth quintile. Wealth quintiles: I = Lowest, II = Lower, III = Middle, IV = Higher, V = Highest. AUC = area under the curve. ∆ AUC: Percent change in AUC compared to Scenario 1 (S1). 95% uncertainty ranges are indicated in parentheses. (S1): distribution of deaths when no treatment is available; S2: current quintile-specific treatment coverage rates; S3: national average of treatment coverage for all quintiles; S4: treatment coverage proportional to quintile-specific baseline mortality risks; S5: equal baseline mortality risk with current quintile-specific treatment coverage rates
Fig. 6
Fig. 6
Distribution of pneumonia deaths by wealth quintile and scenario in Nigeria, Pakistan, and Ethiopia. The numbers in the green boxes represent the percentage of deaths in each wealth quintile. Wealth quintiles: I = Lowest, II = Lower, III = Middle, IV = Higher, V = Highest. AUC = area under the curve. ∆ AUC: Percent change in AUC compared to Scenario 1 (S1). 95% uncertainty ranges are indicated in parentheses. (S1): distribution of deaths when no treatment is available; S2: current quintile-specific treatment coverage rates; S3: national average of treatment coverage for all quintiles; S4: treatment coverage proportional to quintile-specific baseline mortality risks; S5: equal baseline mortality risk with current quintile-specific treatment coverage rates
Fig. 7
Fig. 7
Distribution of diarrhea deaths by wealth quintile and scenario in Nigeria, Pakistan, and Ethiopia. The numbers in the green boxes represent the percentage of deaths in each wealth quintile. Wealth quintiles: I = Poorest, II = Poorer, III = Middle, IV = Richer, V = Richest. AUC = area under the curve. ∆ AUC: Percent change in AUC compared to Scenario 1 (S1). 95% uncertainty ranges are indicated in parentheses. (S1): distribution of deaths when no treatment is available; S2: current quintile-specific treatment coverage rates; S3: national average of treatment coverage for all quintiles; S4: treatment coverage proportional to quintile-specific baseline mortality risks; S5: equal baseline mortality risk with current quintile-specific treatment coverage rates

References

    1. United Nations. Sustainable Development Goals - Goal 1: End poverty in all its forms everywhere. http://www.un.org/sustainabledevelopment/poverty/. Accessed 12 Oct 2016.
    1. The World Bank. Boosting Shared Prosperity is Key to Tackling Inequality, says World Bank Group President. 2014. http://www.worldbank.org/en/news/press-release/2014/10/01/boosting-share.... Accessed 15 Oct 2016.
    1. Nishtar S, Bhutta ZA, Jafar TH, Ghaffar A, Akhtar T, Bengali K, et al. Health reform in Pakistan: a call to action. Lancet. 2013;381(9885):2291–2297. doi: 10.1016/S0140-6736(13)60813-2. - DOI - PubMed
    1. World Health Organization. Closing the Health Equity Gap: Policy Options and Opportunities for Action. WHO Press. 2013. http://apps.who.int/iris/bitstream/10665/78335/1/9789241505178_eng.pdf. Accessed 20 Nov 2016.
    1. World Health Organization . Measles (MCV) Immunization Coverage Estimates by WHO Region. 2016.

Publication types