

Predicted lean body mass, fat mass, and all cause and cause specific mortality in men: prospective US cohort study
- PMID: 29970408
- PMCID: PMC6028901
- DOI: 10.1136/bmj.k2575
Predicted lean body mass, fat mass, and all cause and cause specific mortality in men: prospective US cohort study
Abstract
Objective: To investigate the association of predicted lean body mass, fat mass, and body mass index (BMI) with all cause and cause specific mortality in men.
Design: Prospective cohort study.
Setting: Health professionals in the United States PARTICIPANTS: 38 006 men (aged 40-75 years) from the Health Professionals Follow-up Study, followed up for death (1987-2012).
Main outcome measures: All cause and cause specific mortality.
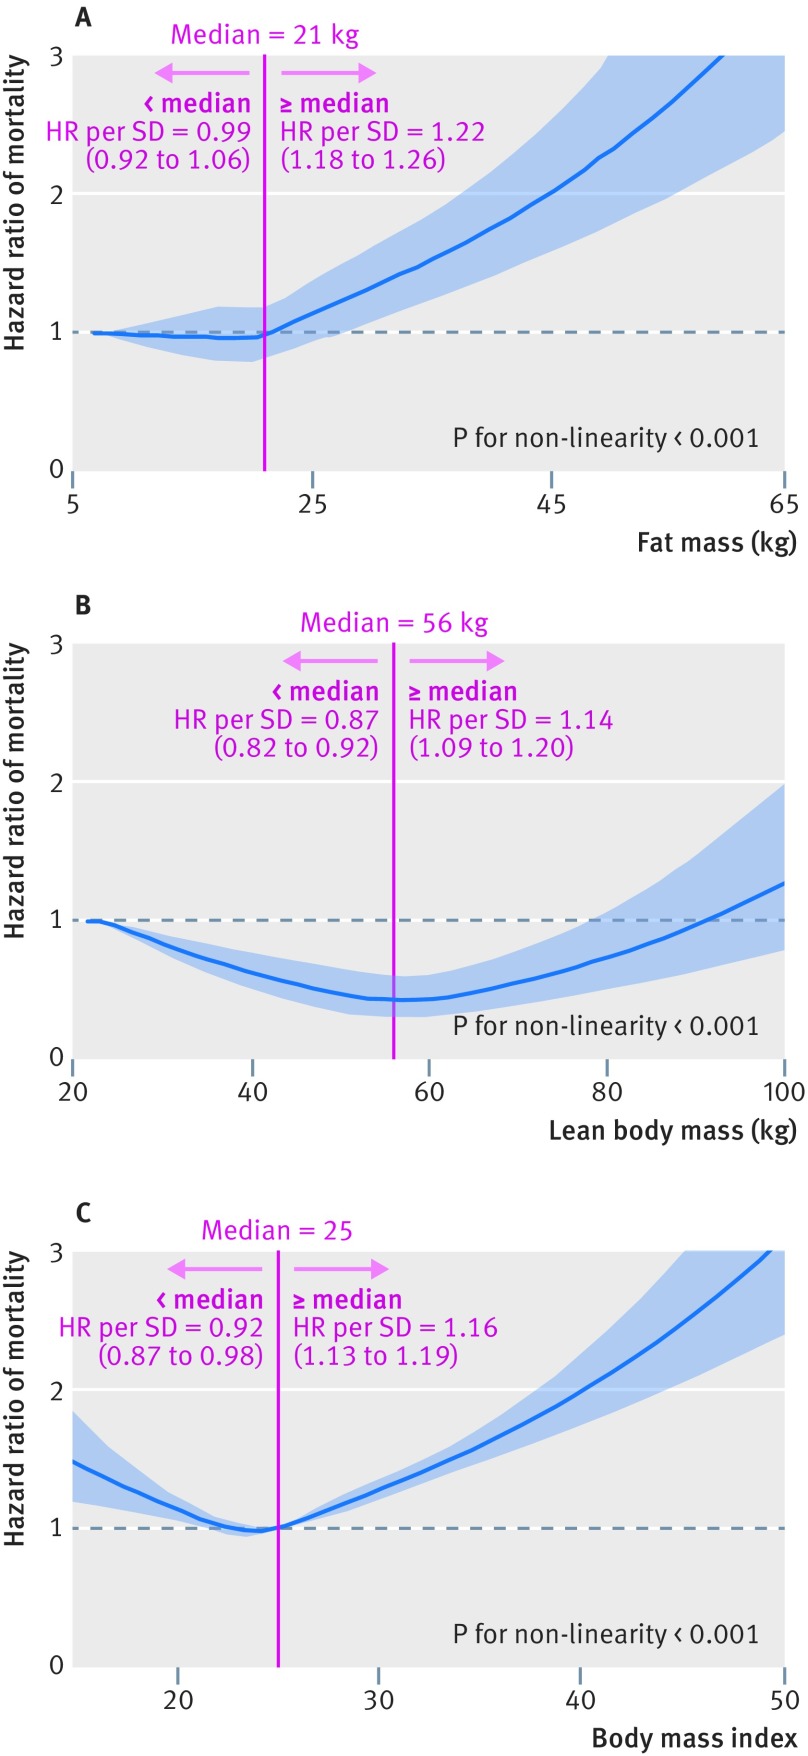
Results: Using validated anthropometric prediction equations previously developed from the National Health and Nutrition Examination Survey, lean body mass and fat mass were estimated for all participants. During a mean of 21.4 years of follow-up, 12 356 deaths were identified. A J shaped association was consistently observed between BMI and all cause mortality. Multivariable adjusted Cox models including predicted fat mass and lean body mass showed a strong positive monotonic association between predicted fat mass and all cause mortality. Compared with those in the lowest fifth of predicted fat mass, men in the highest fifth had a hazard ratio of 1.35 (95% confidence interval 1.26 to 1.46) for mortality from all causes. In contrast, a U shaped association was found between predicted lean body mass and all cause mortality. Compared with those in the lowest fifth of predicted lean body mass, men in the second to fourth fifths had 8-10% lower risk of mortality from all causes. In the restricted cubic spline models, the risk of all cause mortality was relatively flat until 21 kg of predicted fat mass and increased rapidly afterwards, with a hazard ratio of 1.22 (1.18 to 1.26) per standard deviation. For predicted lean body mass, a large reduction of the risk was seen within the lower range until 56 kg, with a hazard ratio of 0.87 (0.82 to 0.92) per standard deviation, which increased thereafter (P for non-linearity <0.001). For cause specific mortality, men in the highest fifth of predicted fat mass had hazard ratios of 1.67 (1.47 to 1.89) for cardiovascular disease, 1.24 (1.09 to 1.43) for cancer, and 1.26 (0.97 to 1.64) for respiratory disease. On the other hand, a U shaped association was found between predicted lean body mass and mortality from cardiovascular disease and cancer. However, a strong inverse association existed between predicted lean body mass and mortality from respiratory disease (P for trend <0.001).
Conclusions: The shape of the association between BMI and mortality was determined by the relation between two body components (lean body mass and fat mass) and mortality. This finding suggests that the "obesity paradox" controversy may be largely explained by low lean body mass, rather than low fat mass, in the lower range of BMI.
Published by the BMJ Publishing Group Limited. For permission to use (where not already granted under a licence) please go to http://group.bmj.com/group/rights-licensing/permissions.
Conflict of interest statement
Competing interests: All authors have completed the ICMJE uniform disclosure form at http://www.icmje.org/coi_disclosure.pdf (available on request from the corresponding author) and declare: no support from any organization for the submitted work other than that described above; no financial relationships with any organizations that might have an interest in the submitted work in the previous three years; no other relationships or activities that could appear to have influenced the submitted work.
Figures
Comment in
-
Body composition - more to fat than first meets the eye.Nat Rev Endocrinol. 2018 Oct;14(10):569-570. doi: 10.1038/s41574-018-0088-z. Nat Rev Endocrinol. 2018. PMID: 30154527 No abstract available.
References
-
- Obesity: preventing and managing the global epidemic. Report of a WHO consultation. World Health Organ Tech Rep Ser 2000;894:i-xii, 1-253. - PubMed
-
- Centers for Disease Control and Prevention. National Health and Nutrition Examination Survey. 2018. http://www.cdc.gov/nchs/about/major/nhanes/datalink.htm.
-
- Hu F. Obesity epidemiology. Oxford University Press, 2008. 10.1093/acprof:oso/9780195312911.001.0001. - DOI
Publication types
MeSH terms
Grants and funding
LinkOut - more resources
Full Text Sources
Other Literature Sources
Medical